

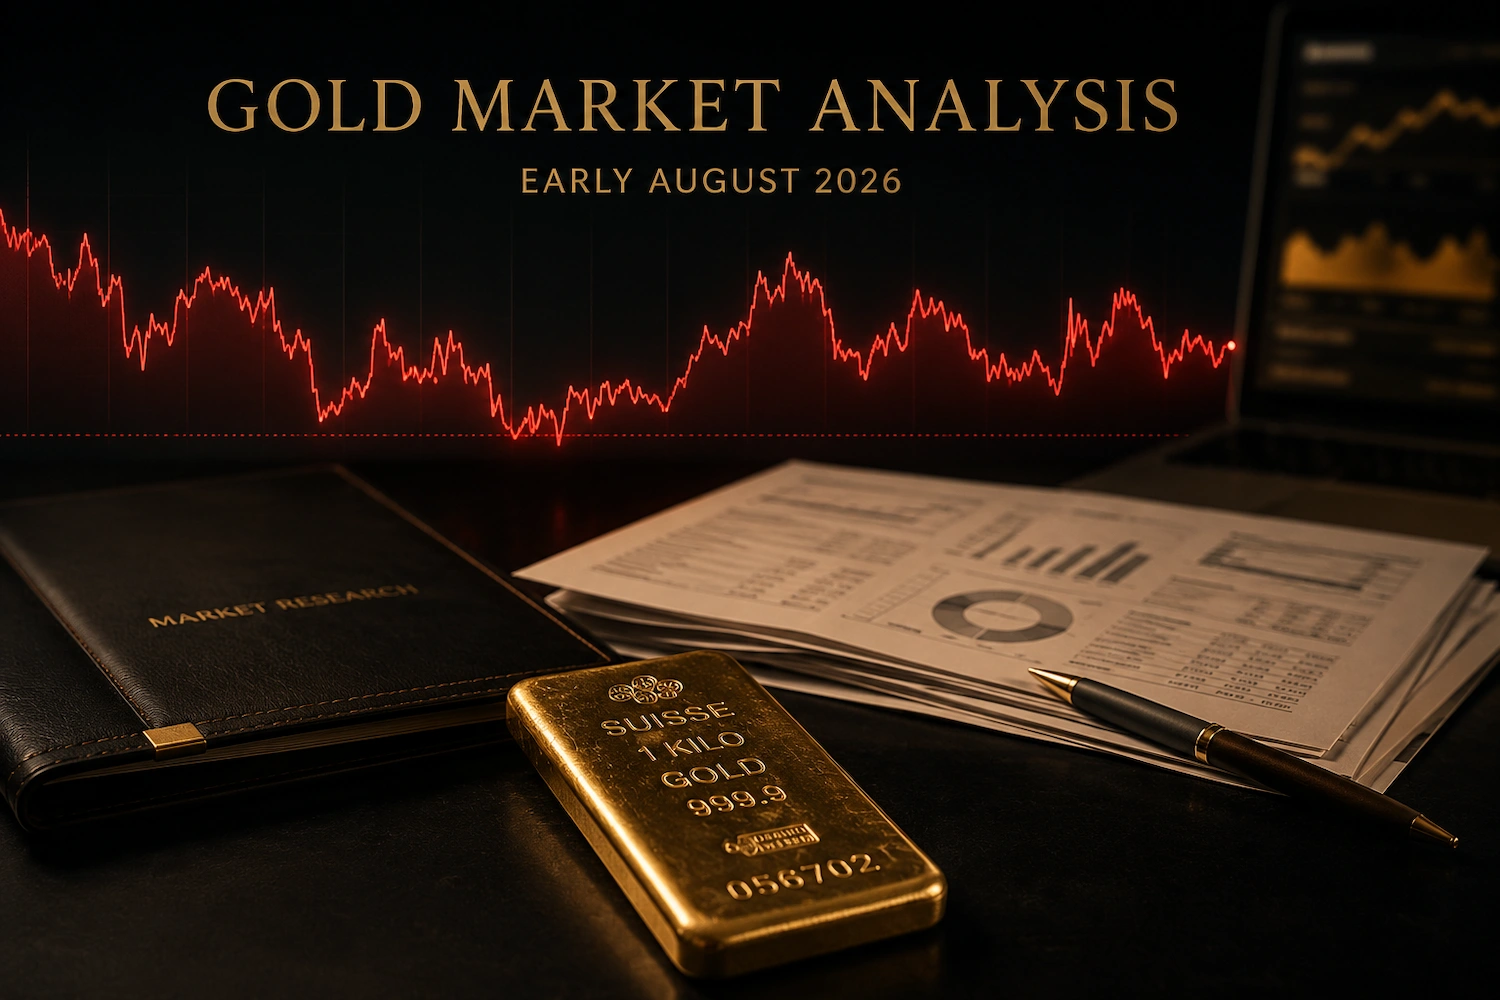
Sized in January, a gold position — or a client mandate referenced against it — was priced in a different regime. Spot then sat near its record around $5,600, and sell-side year-end targets, published against a Federal Reserve expected to cut, clustered between about $4,900 and $6,300. By early August 2026 spot holds above $4,000 an ounce after the worst quarter since 2013. Hike odds for September have swung around even since late June, and the June–July round of bank notes has moved those targets lower. Treasury desks, family offices and relationship managers reconciling holdings or client positions against that gap need the record itself — the price path, the policy reset, official-sector flows, fund flows — with each figure attributed and each revision dated. That record follows; bank-by-bank forward targets sit on the 2026–2027 forecast page.
Price level and the 2026 path
On 3 August 2026 the benchmark close put spot gold at $4,038.16 an ounce, while a live dealer feed that evening marked $4,071.13 — two public figures for one date, $33 apart, hours apart. That gap is itself operational information: any figure carried into reconciliation or reporting needs a source and timestamp attached. Every figure on this page is an indicative reference price — delayed, rounded and aggregated from third-party market data; none is an executable quotation.
The path to this level, in five dated points:
| Date | Spot level | What happened |
|---|---|---|
| 29 Jan | $5,586.20 (UBS spot basis); some feeds record ~$5,602 | Record high |
| 24 Jun | below $4,000 | First break of the level since November |
| 30 Jun | $4,027.03 at the quarter close; ~$3,942 intraday on the final morning | Q2 ends about 16% lower — the worst quarter since Q2 2013; June alone fell over 11%, the steepest month since October 2008 |
| 15 Jul | ~$4,020–4,050 | Consolidation around the $4,000 test |
| 3 Aug | $4,038 at the close; intraday above $4,050 | Recovery on easing oil and a dollar at its lowest since mid-June |
The drawdown is deep by reference date, not by holding period: spot sits more than a quarter below the January record, around 7.5% lower year-to-date, and still roughly a fifth above its level twelve months ago. A valuation, collateral mark or client mandate referenced against a Q1 print therefore carries a basis 25–30% above the current market — the reference date on the document, not the position itself, determines the size of the gap a desk reconciles today. The flow-level mechanics of the drawdown — which legs, which sellers, in which order — are treated in the 2026 correction analysis.
The policy reset: from cut expectations to hike risk
Gold entered this period with dovish Fed expectations as a tailwind, which — per UBS commodity analyst Giovanni Staunovo — left it more sensitive to macro drivers once stronger US data, higher real yields and a firmer dollar arrived. Leadership and data moved together: Kevin Warsh used his debut press conference as Fed Chair to signal the central bank would not tolerate high inflation, while Cleveland Fed President Beth Hammack said she sees little evidence current rates restrain the economy, with further hikes possibly needed to reach the 2% target.
By the quarter’s end, futures put the odds of a September hike near 64%, the 10-year Treasury yield stood near 4.39%, and the dollar had rallied for a second straight month. Position math moved with the pricing. Financing cost against a held position now compares to higher-for-longer short rates, and storage-fee-plus-funding set against expected appreciation reprices on the same input; a settlement deferred in January on the expectation of cheaper money carries the difference as realized cost, and where an internal policy document or client mandate fixed a rate assumption at the start of the year, the sign of that assumption — cuts — has flipped. June’s CPI release then pulled hike odds back toward even by mid-July: headline inflation slowed to 3.5% from 4.2% in May, with consumer prices posting their first monthly decline since 2020. Holder behavior shifted with the rates view — Saxo Bank’s Ole Hansen describes holders who now “sell into strength rather than buy into weakness”, a reversal of the dip-buying pattern of 2024–2025.
As of its late-June note, BofA Securities’ base case carries three rate hikes in 2026.
Energy prices and the rates channel
Through the first half of 2026, what moved gold ran from energy costs into the policy rate outlook: higher energy prices fed headline inflation — 4.2% in May — and pushed rate expectations toward tightening, and a non-yielding asset reprices lower on that path. That old reflex, “risk event → gold bid”, failed on the tape — on one early-July session oil rose, the S&P 500 lost about half a percent, and gold futures slipped 0.2% the same day, the metal moving with equities, off the rates read, in a session that breaks any mapping keyed to headline flow. UBS’s Staunovo attributes the pattern to starting conditions: gold entered the period with elevated valuations and a dovish rate consensus already priced, leaving macro variables in control of the price. By late June, options markets paid more for downside protection on gold than for upside exposure for the first time since 2016 — confirmation from positioning.
When energy pressure eased, the chain ran back: Fed Chair Warsh noted at Sintra that energy prices had come down substantially while remaining above earlier levels, and spot gold rose as much as 1.6% to $4,071.04 on those remarks; mid-July sessions with renewed pressure then sent gold back toward the $4,020–4,050 band. Early August supplied the easing leg in full — oil came off, the dollar slid to its lowest since mid-June, spot recovered above $4,050 intraday on 3 August — and a book holding bullion sized against tail risk gained on exactly the combination, falling energy prints and fading hike odds, that costs it when the signs reverse. Each leg has now printed. Softer energy lowers the expected inflation path, trims priced hike odds and lifts gold; firmer energy runs the chain in reverse.
Official-sector demand: what the reported data shows
Sixteen tonnes of net reported purchases against headline sales of about 129 tonnes: on those numbers, the official-sector bid looked to have left in the first quarter, with Türkiye alone selling 60 tonnes in March — figures JPMorgan’s commodity research flagged as the softest reported quarter of the cycle. JPMorgan set the physical counter-evidence next to them: China’s net gold imports tripled quarter-on-quarter to 317 tonnes, while the PBoC’s reported additions accelerated from about a tonne a month to 5 tonnes in March and 8 in April. Reported reserve changes and physical flows are two different ledgers, and in Q1 they pointed in opposite directions.
May closed the gap in favor of accumulation. Official reserves rose a net 41 tonnes for the month, with China adding 10 tonnes — its largest reported increase since December 2024, taking holdings to 2,332 tonnes, about 9% of total reserves — and preliminary data showing Poland adding 18 tonnes. Forward-looking indicators tilt toward accumulation as well: a record 89% of 76 surveyed central banks expect global gold reserves to rise this year, and OMFIF finds central banks inclined to cut dollar exposure over the coming decade while adding gold near term. Goldman’s commodities research treats official-sector diversification away from dollar-denominated reserve assets, underway since 2022, as the structural anchor of its outlook. Published 30 July, the World Gold Council’s Q2 accounting keeps the official sector on course for a strong year while likely below the 2025 total — the second-quarter rebound recovered only part of the weak reported first quarter — and treats tactical sales tied to liquidity or currency management as possible inside an unbroken strategic diversification trend.
Before this demand is read into a position, two adjustments apply. Tonnage comparisons across years mis-state the bid at doubled prices — JPMorgan’s ~755-tonne estimate for 2026 sits below the 1,000-tonne years of 2022–2025 largely because an unchanged reserve-share target now costs fewer ounces — so comparisons hold in value or reserve-share terms. And the official bid functions as depth under the market: steady, price-insensitive demand separates an orderly correction from a disorderly one, which bears directly on exit-liquidity assumptions for gold held as an institutional reserve asset.
Investment flows: ETFs and physical bars
Having supplied steady support, fund flows turned into the swing factor of the half-year. Goldman Sachs cited fading ETF inflows as one ground for lowering its end-2026 estimate in June, and flow behavior around the $4,000 mark has turned directional: analysts flag a clean break below that level as the likely trigger for a further wave of ETF liquidation, while a hold above it draws buyers who read the drawdown of about 28% as an overshoot. Q2 data bears the swing out: gold-backed ETFs shed 45 tonnes over the quarter while flows across the half held modestly positive at 18 tonnes — six months containing both directions. In this regime the marginal price is set by fund flows, and they can reverse within a session.
In May, India — a bellwether physical market — logged record ETF outflows as holders booked profits after a duty-driven rally, with inflows resuming in June; physical buying across jewellery, bars and coins softened that month under higher duties and elevated domestic prices, and digital gold purchases slowed while staying above average. Across regions, the World Gold Council’s quarterly data shows bar and coin within 3% of a year earlier and half-year volumes 21% higher, with over-the-counter demand of 327 tonnes — 571 across the half — moving through Asian institutional channels that never print in fund-flow data. Demand of this kind moves on a slower clock, and for a counterparty holding allocated physical bullion next to fund exposure the operational distinction is settlement behavior: fund positions mark and move intraday, while bar demand — official and private — shows in monthly series and reprices through premiums and dealer spreads — the terms that surface in physical gold purchase coordination for qualified counterparties.
The mid-year revision wave on the sell side
Between mid-June and mid-July the published sell-side estimates moved lower as a group. Goldman Sachs cut its end-2026 level to $4,900 from $5,400, citing fading fund inflows and a later start to rate cuts, while stating that medium-term risks to its level remain skewed to the upside. HSBC’s 9 July note lowered its 2026 average to $4,560 from $4,864, with an end-2026 marker of $4,750 and an end-2027 marker of $5,025. A JPMorgan revision reported on 3 July moved near-term levels to $4,300 for Q3 and $4,500 for Q4; the bank’s public research page still displayed the earlier, higher path in mid-July, so that revision rests on press-report attribution pending the primary note. UBS keeps a 12-month level of $5,200 on the view that dollar strength fades and the Fed settles into a hold.
The aggregate shift is larger than any single call: the January cluster of year-end estimates near $4,900–6,300 has compressed toward the $4,300–5,200 area. Consensus markers collected before the revision round — the LBMA analyst survey averaging $4,742 and a Reuters poll median of $4,916 — now stand as pre-revision benchmarks — snapshots of the consensus before the June–July cuts — and the World Gold Council’s mid-year view frames the second half as rangebound around $4,100 within about five percent. The bank-by-bank set — levels, revision dates, direction of each change — is maintained as a single dated table on the 2026–2027 targets page.
Any internal document or client communication that quotes a sell-side level needs the note date attached; this quarter the publication date does more identifying work than the institution name. As much as $1,500 an ounce separates the January print from the July revision at a single institution.
What updates this picture: the data calendar
As of 3 August 2026, every figure above stands current, with the 30 July Gold Demand Trends release already folded into the demand sections. Monitoring order follows the transmission chain documented above — rates data first, demand data second, sell-side notes as derivatives of both — and the scheduled releases below supersede the figures in that order:
- Mid-August — US CPI for July. Direct input to the September-meeting odds that currently price gold’s path — and the first test of whether the June slowdown to 3.5%, with the first monthly decline in consumer prices since 2020 behind it, extends beyond a single print or reverts toward the May pace of 4.2%.
- Monthly reported reserve updates (IMF/WGC cadence). Extend the May accumulation series — the 41-tonne net month — into June and July.
- Next quarterly consensus polls (LBMA, Reuters). Replace the pre-revision benchmarks with post-revision medians.
- September FOMC meeting. Resolves the near-even hike pricing; the December meeting stands as the second monitored date.
By the September meeting, all four will have printed, and each figure above will read as a dated record of the early-August market.
Sources
- World Gold Council — Gold Demand Trends Q2 2026 (30 July 2026): Q2 and H1 demand totals, ETF outflows, bar and coin volumes, OTC demand, official-sector view. Supporting pages: press release, India Focus.
- Trading Economics — Gold (accessed 3–4 August 2026): 3 August close, monthly and year-on-year change.
- Goldman Sachs year-end revision, 19 June 2026 — end-2026 level to $4,900 from $5,400; first expected Fed cut moved to 2027 (press coverage, 22 June).
- JPMorgan Q3/Q4 revision, 3 July 2026 — $4,300 Q3 average and $4,500 Q4, replacing the $6,000 path issued 9 June (press reporting; primary note not publicly available).
- HSBC forecast revision, 9 July 2026 — 2026 average to $4,560 from $4,864 and 2027 average to $4,925, with year-end markers of $4,750 and $5,025 held (press coverage after Reuters, 9–10 July).
- UBS, BofA Securities and Saxo Bank commentary; LBMA analyst survey; Reuters quarterly poll; OMFIF survey; World Gold Council mid-year H2 view — client research and survey publications, positions as carried in financial press, June–July 2026.
- Federal Reserve communications — Chair Warsh’s debut press conference and Sintra remarks; Cleveland Fed President Hammack’s comments — public record via press coverage, June–July 2026.
- US CPI prints (May, June 2026) — Bureau of Labor Statistics data as carried in market reporting.