
Week of 6–10 July 2026. Indicative XAU/USD reference: $4,032.50/oz — mid-quote, as of 30 June 2026, 11:59 UTC. The figure is an indicative market reference for valuation and sizing, not an executable price; a binding figure on a specific lot is set at contract.
Pricing a physical gold lot is a point-in-time exercise against a spot reference that moves with the macro calendar and with where the largest desks are positioned. For the week of 6–10 July 2026 the catalysts are mostly fixed in advance — a thin first-tier data slate built around a single Federal Reserve release — and the support and resistance levels the analyst field is watching are already on the record. What is not knowable is which way each print lands. The forward view below stays with what is scheduled and what named desks are watching, attributed to source and without a Golden Ark Reserve call on direction, because for a buyer or an intermediary sizing an allocation the operational question is narrower than where gold is going: it is when the reference is most exposed to a move before a quote is locked. Gold enters the week near $4,030, below the moving averages most desks track, after a run of weekly declines; the drivers behind that move are set out in the latest market note.
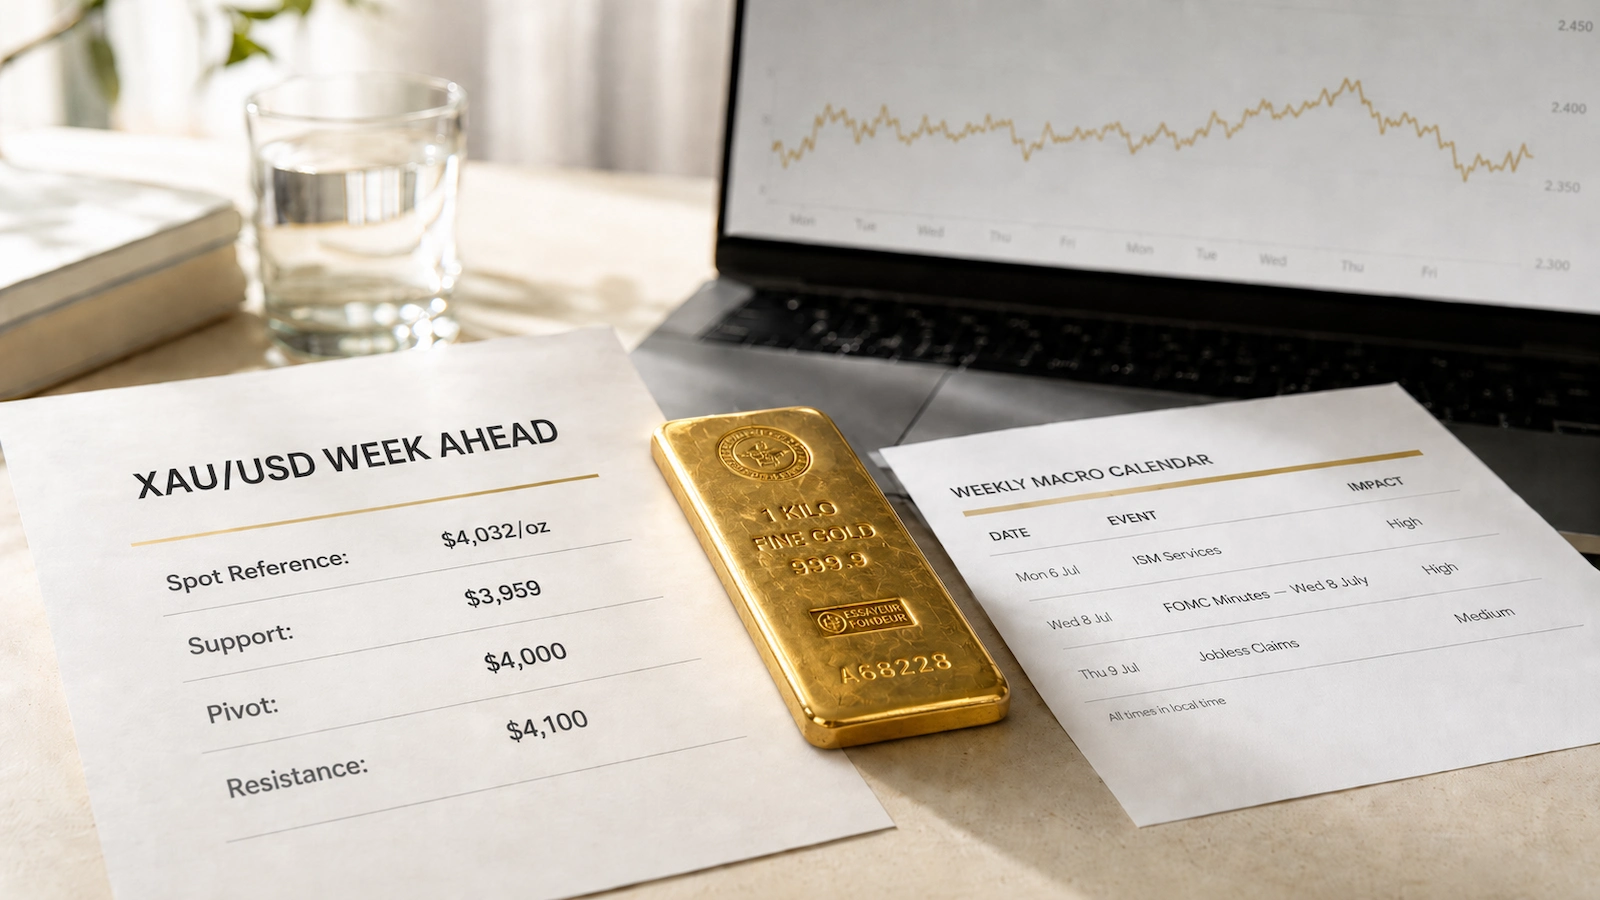
Key levels analysts are watching
At the open of the week, spot sits just above the $4,000 mark — the level the desk field treats as the near-term pivot. The metal briefly traded through it in late June, and Marc Chandler of Bannockburn Global Forex, a foreign-exchange and macro advisory firm, noted that the dip below $4,000 drew bargain hunters even as gold had not settled back above its five-day moving average since 16 June. Below the round number, the reference point analysts cite is the seven-month low at $3,959, printed in the late-June sell-off; FXStreet, a markets-news service, flags that level as the next support and the line whose breach would open a steeper decline.
On the topside, the levels in view are the late-June recovery cap near $4,100 and, above it, the moving-average band that defines the broader trend. FXStreet places the next technical caps at the 100-period and 200-period moving averages, around $4,187 and $4,349. J.P. Morgan’s Greg Shearer, head of base and precious metals research, framed the bigger picture in the bank’s own commentary: gold has been stranded between its major moving averages — above the 200-day, which he placed near $4,340, but capped below the 50-day near $4,730 — i.e. beneath the averages that mark its uptrend, and, by his account, on the back burner for most investors. Spot has since slipped toward $4,000, below both.
For a buyer, the practical reading is the band, not any single line: desks are watching roughly $3,959 on the downside and the $4,100 area on the topside this week, with the larger moving-average caps well above the market. A quote requested mid-week prices off wherever spot sits within that band at the moment of contract, not off any of these reference levels — they mark where attention is concentrated, not a Golden Ark Reserve view of direction.
The week-ahead macro calendar
The previewed week opens with the June employment report already absorbed. The US Bureau of Labor Statistics released non-farm payrolls on Thursday 2 July, pulled forward ahead of the observed Independence Day holiday that closed US markets on Friday 3 July, so positioning into 6–10 July reflects that print rather than anticipates it. The week’s own first-tier slate is light, and one release dominates it:
- Early in the week — the June ISM services index, the Institute for Supply Management’s reading of US non-manufacturing activity.
- Wednesday 8 July, 2:00 p.m. ET — the minutes of the 16–17 June FOMC meeting. That meeting held the federal funds target at 3.50–3.75% on a 12–0 vote, and its statement stressed that inflation remained elevated relative to the 2% goal; the accompanying Summary of Economic Projections shifted the median 2026 rate path higher, toward at least one further increase rather than the cut markets had carried into the year. The minutes are parsed for how firmly that hawkish lean was held across the committee.
- Thursday 9 July — weekly initial jobless claims.
Federal Reserve officials also speak through the week; the next rate decision is not until 28–29 July. The heavier inflation tests sit just beyond the window: June CPI and PPI are scheduled for the following week, in mid-July. Within 6–10 July, Wednesday’s minutes are the scheduled point of maximum sensitivity for a rate-driven gold tape; the larger inflation read lands the week after.
What the desks expect next week
Heading into the period, the most recent weekly canvass — the Kitco News Weekly Gold Survey, published 26 June — found a bearish plurality. Of 18 Wall Street analysts, 44% looked for lower prices against 28% higher and 28% sideways, and the parallel retail poll of 238 votes ran 46% to the downside. The named commentary around that split pulled both ways. Adrian Day of Adrian Day Asset Management called the outlook uncertain, weighing a possible renewed Iran flare-up against an equity and technology sell-off that could force liquidation into gold, with US margin debt at record highs. He also noted that CPI could ease over the coming months as lower oil feeds through to pump prices, which might stay the Fed’s hand, and flagged a possible retest of the late-June lows before any recovery. Neil Welsh of Britannia Global Markets read sentiment as cautious but saw consolidation rather than capitulation. CPM Group, a precious-metals research firm, put the move down to investor-driven selling against firm equities, easing oil as Strait of Hormuz flows rose, and Fed communication pointing to higher rates.
The dominant force into the week, the research field broadly agrees, is the repricing of Fed policy and the dollar, not safe-haven demand; the unresolved US–Iran and Strait of Hormuz situation remains a two-sided wildcard. None of this resolves into a consensus on near-term direction — a read on reference volatility, not a basis for timing a purchase. The published bank targets have moved lower in step. Deutsche Bank cut its 2026 gold targets to $4,300 for the third quarter and $4,800 for the fourth, and ING lowered its forecasts on rising yields and a firmer dollar.
Where this sits versus the 2026–2027 forecast
At roughly $4,030, the metal trades well below the full-year targets the major banks still carry. J.P. Morgan projects gold to average around $6,000 by the fourth quarter of 2026, and Deutsche Bank, even after its recent cut, holds a $4,800 fourth-quarter target — both far above the current mark. That distance between the week-ahead tone and the full-year field is the context a physical buyer holds when reading any single week. The full-year picture — the targets, the central-bank-demand and rate-path assumptions behind them, and the risks to each — is set out in Gold Price Forecast 2026–2027.
Pricing remains lot-specific. The indicative reference above values a notional ounce of unallocated gold; the executable figure on a defined position — format, refinery origin, allocation, and delivery destination — is set at contract, against the prevailing two-sided market at the moment of pricing. A proposal on a specific lot runs through physical gold purchase. The week-ahead caution and the full-year targets describe the same metal on two horizons. J.P. Morgan’s ~$6,000 average for late 2026 rests on assumptions about central-bank demand and the rate path — premises that one data-light week does little to settle.
Sources
- Golden Ark Reserve — Gold Price Today: Golden Ark Reserve’s indicative XAU/USD mid-quote; the spot reference of record for this page.
- Golden Ark Reserve — latest market note: the dated weekly review of what drove the most recent move.
- US Federal Reserve — FOMC, 16–17 June 2026: official rate-decision statement, projections, and the meeting-minutes release schedule (minutes released three weeks after the decision).
- Kitco News — Weekly Gold Survey, 26 June 2026: weekly poll of bullion-market analysts and retail investors, with named desk commentary.
- FXStreet — Gold (XAU/USD) analysis: markets-news service; near-term technical levels.
- J.P. Morgan Global Research — gold price outlook: bank research; Greg Shearer commentary and full-year targets.
- Deutsche Bank and ING forecast revisions (reported by Kitco News): third-party bank-desk target changes.