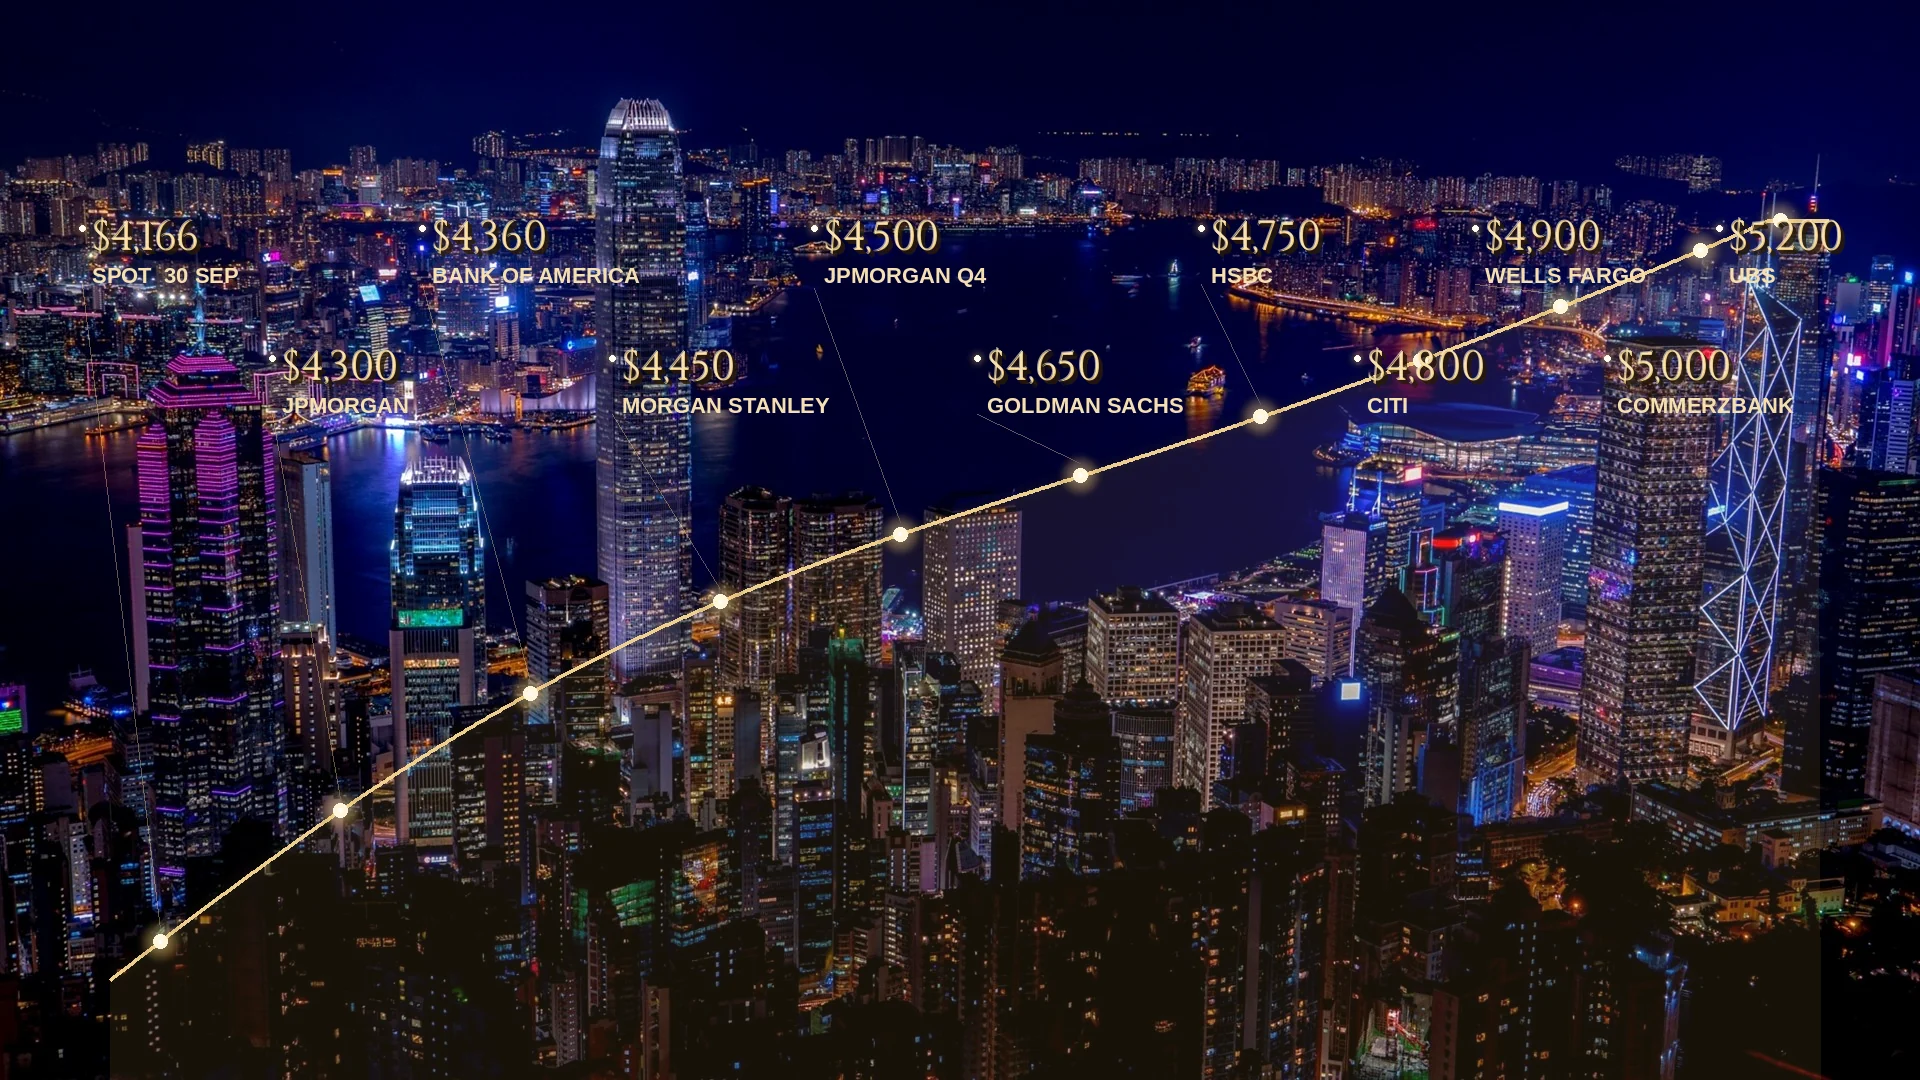
Gold Price Forecast 2026: Bank Targets — September Update

US payrolls rose 162,000 in August against a consensus near 55,000, and the same release revised July from a 23,000 loss to a 21,000 gain. Spot gold fell 2.2% to $4,376.04 on the print, and September-hike pricing — 63% on Wednesday, 50% on Thursday after Governor Christopher Waller signalled he could hold — moved back above even. None of the bank targets below moved. They last moved in August, when the field split by direction for the first time this year: Wells Fargo Investment Institute cut its year-end range to $4,900–5,100 in the week of 17 August, and Citi lifted its three-month target to $4,800 the Monday after, one session before spot peaked at $4,696.18 and turned away from it. August closed about 10% higher. Over the four weeks since, the market has crossed a handful of published levels ten times in both directions while the levels themselves went unrewritten. This is where the field stands on 4 September, ahead of the 11 September CPI print and the 16 September FOMC. The August edition records the field as it stood before that round.
Where the field stands in September
Spot traded at $4,376.04 after the payrolls release, and that is the level each published target is read against. Every figure here is an indicative reference price — delayed, rounded and aggregated from third-party market data; none is an executable quotation.
| Forecaster | Published level | Note date | Last move |
|---|---|---|---|
| JPMorgan | $4,300 Q3 average; $4,500 Q4 | 3 Jul | ↓ from a higher June path |
| Bank of America | $4,360 2026 average | 8 Jul | ↓ from $5,093 |
| Morgan Stanley | $4,450 Q4 2026 base case | 20 Aug | held; reached by spot |
| HSBC | $4,750 year-end; $4,560 2026 average | 9 Jul | ↓ average; year-end marker held |
| Citi | $4,800 on 0–3 months; $5,000 on 6–12 months | 24 Aug | ↑ near-term from $4,500 |
| Goldman Sachs | $4,900 year-end | 19 Jun | ↓ from $5,400 |
| Wells Fargo Investment Institute | $4,900–5,100 year-end | week of 17 Aug | ↓ from $5,300–5,500 |
| Commerzbank | $5,000 year-end | carried in a Reuters analyst poll, not a dated note | ↑ from $4,400 |
| State Street Global Advisors | $5,000 base case into early 2027 | July Monthly Gold Monitor | — |
| UBS | $5,200 on a 12-month view | May | ↓ from $5,500 |
Two publishers stay out of the register. Deutsche Bank’s levels conflict across press reports with no primary note available. Standard Chartered’s reported August revision cannot be reconciled: the figure it is said to have raised from does not match the fourth-quarter level the bank itself published in December.
Before any row is quoted against a position, the horizon it was written on has to be read with it, because the column holds three incompatible objects. Year-end and quarter-end markers measure against a print, and those run $4,450 to $5,100 — Morgan Stanley’s base case now $74 above spot, Wells Fargo’s revised ceiling $724 above it. Annual averages sit below that band by construction rather than by disagreement: Bank of America’s $4,360 and HSBC’s $4,560 average a year that opened at a $5,586.20 record in January and traded below $4,000 in June, so they describe a different object than Goldman’s year-end $4,900. Citi’s pair is a third kind again — rolling windows that re-date themselves as they roll, so its $4,800 refers to whatever three months follow the note rather than to December.
Both consensus markers on record predate the June–July round and stand unreplaced until the next quarterly collections print: the LBMA analyst survey at $4,742 and a Reuters poll median near $4,916.
August’s two-way revision round
Wells Fargo Investment Institute supplied the month’s cut. In the week of 17 August the institute took its year-end 2026 range to $4,900–5,100 from $5,300–5,500 and its 2027 range to $5,400–5,600 from $5,800–6,000, both ends down $400, in what reporting on the note identified as the third downward revision it had published in 2026. February was the starting point, when that desk raised the 2026 range to $6,100–6,300 with gold near $4,961; the midpoint has travelled from $6,200 to $5,000 in roughly six months. One link in that chain is undated in available reporting — the $5,300–5,500 range the August note cut from sits below the February figure, so at least one reduction fell between them without a date attached to it in press coverage.
Citi went the other way on 24 August, and the timing is the useful part. Reuters reported the desk lifting its zero-to-three-month target to $4,800 from $4,500 while holding $5,000 on six-to-twelve months. Spot was already above $4,600 when that landed, so the near-term number was catching up to the tape rather than leading it; the following session produced the month’s high at $4,696.18, and the raised target was never touched. A target moved to meet an advance, and the advance ended within twenty-four hours of the move.
Commerzbank also carries a raise, to $5,000 for 2026 against $4,400 before, with $5,200 for 2027. That entry reaches the field through a Reuters analyst poll rather than a dated house note, which is why it has no revision date and cannot be placed in the August sequence with any precision.
Morgan Stanley registered a fourth kind of move, which is not a revision at all. On 20 August, commodity strategist Amy Gower wrote that gold had reached the bank’s fourth-quarter forecast of $4,450 faster than expected, and set out a path above $5,000 in 2027 with scope for volatility along the way. The bank had already cut its second-half target to $5,200 from $5,700 in April; August did not change the number, it noted that the market had arrived at it.
One item belongs to July but only became visible in the field during August. Bank of America’s metals desk under Michael Widmer formally cut the 2026 average forecast by 14% on 8 July, to $4,360 from $5,093, citing a more hawkish Federal Reserve while keeping $5,000 reachable once the tightening cycle ends. A higher year-end figure attached to the bank continued to circulate through late July and into August, after the desk had replaced it with a different metric on a different horizon. Anyone holding that number in a comparison sheet is holding a level the publisher had already superseded.
For anyone maintaining such a sheet, the consequence is that a single field-level summary no longer works. Through June and July every recent move was a cut, so “the published targets came down” described the whole field accurately and direction could be inferred from the date alone. From August it cannot. Five moves reached the field between early July and the end of August: two reductions, two increases, and one desk recording that the market had overtaken a standing number. Level and note date identify a row only when the direction of the last move is carried with them.
What the price did to the targets
Between 3 and 25 August spot passed up through four of the levels in the register. Over the six sessions to 2 September it fell back below three of them, on 3 September it crossed two of those the other way again, and the payrolls print took one of the two back down.
| Level | Publisher and horizon | Path on a closing basis |
|---|---|---|
| $4,300 | JPMorgan, Q3 average | up 3–12 Aug; never re-crossed |
| $4,360 | Bank of America, 2026 average | up 3–12 Aug; down 28 Aug–2 Sep; up 3 Sep; held 4 Sep |
| $4,450 | Morgan Stanley, Q4 base case | up 12–25 Aug; down 28 Aug–2 Sep; up 3 Sep; down 4 Sep |
| $4,500 | JPMorgan Q4; Citi 0–3m until 24 Aug | up 12–25 Aug; down 28 Aug; touched intraday 3 Sep |
| $4,750 | HSBC, year-end | not reached |
| $4,800 | Citi, 0–3m from 24 Aug | not reached |
| $4,900 | Goldman year-end; Wells Fargo floor | not reached |
| $5,000 | Commerzbank; State Street; Citi 6–12m | not reached |
| $5,200 | UBS, 12-month | not reached |
One of those crossings is not a crossing in the same sense. Bank of America’s $4,360 is an annual average, and a spot print passing through an average settles nothing about whether the average will be met: a year that spends September at $4,376 and December at $4,900 satisfies neither figure. Only the year-end and quarter markers measure directly against a print, and Citi’s rolling window measures against neither, since it moves with the calendar.
The register also mixes three kinds of publisher, and the kind governs how a revision should be read. Most rows are sell-side commodities research written for trading and institutional clients — Amy Gower, whose August note sits above, is Morgan Stanley’s metals and mining commodity strategist, and output of that sort feeds the consensus collections. Wells Fargo Investment Institute is a different instrument: the investment-strategy arm that sets house views for the bank’s wealth-management advisers, which is why its output is a range rather than a point and why three downward revisions inside 2026 is ordinary cadence for it. State Street Global Advisors is an asset manager publishing a monthly monitor for allocators. Read as one field, those rows look more contradictory than they are.
Where this lands operationally is on review triggers. A mandate, valuation policy or client reporting rule keyed to a named sell-side level fired four times between 3 and 25 August, unfired three times over the following six sessions, fired twice again on 3 September and unfired once on the payrolls print — ten events in four weeks, no revision to any of the levels between them, and the same document reviewed against opposite readings four times.
One note survived the month intact, and the reason is its construction. HSBC’s James Steel cut the 2026 average to $4,560 on 9 July but published a $3,800–4,700 trading band alongside a $4,750 year-end marker and left the marker alone. Seven weeks later August’s peak stopped $3.82 below the top of that band and never tested the destination. A forecast that separates path from endpoint can be wrong about the route while its endpoint still stands; a single point estimate has no such structure, and every point estimate in the register was overtaken or missed within those four weeks.
JPMorgan’s $4,300 Q3 average is the only row carrying a resolution date: the quarter closes on 30 September. The session-level mechanics behind the August path — flows, policy and energy — are treated in the September market analysis.
The rate call underneath the metal call
Every level in the register rests on a rate assumption, and those assumptions are not the same width. Most of the June–July cuts encoded a single change: the Federal Reserve would not ease in 2026. Goldman Sachs moved its first expected cut to June 2027 on 19 June. Bank of America went further along that path and wrote a base case of three hikes in 2026, published alongside its 8 July decision to cut the 2026 average to $4,360 from $5,093. In July that was the outlier position in the field.
Since then the market has moved toward it in sign and away from it again more than once, without ever approaching it in size. September-hike pricing ran near 60% at the end of August and 63% on 2 September; comments from New York Fed President John Williams that day and from Governor Christopher Waller the next took it to about 50%; the August payrolls print pushed it back above even. Through all of it, one hike has remained the market’s expectation and three remains Bank of America’s. Whether those three fall across the September, October and December meetings is not established in available reporting; the desk published the count, not the schedule.
That gap is what makes the dispersion legible. A field where the hawkish outlier called direction correctly while magnitude stayed unresolved produces a wide spread of year-end levels for one reason — the levels price different tightening paths, not different views of gold. Goldman’s $4,900 and Bank of America’s $4,360 average are separated more by how many hikes each assumes than by any disagreement about official-sector demand, which both desks treat as structural support. Where an internal document quotes a gold level against a rate assumption of its own, the two need checking against each other: a level published on a three-hike path carries no information for a policy built on one.
The 2027 horizon
Through both revision rounds the 2027 numbers moved less than the 2026 ones, and the asymmetry is the read.
Wells Fargo Investment Institute cut both years by the same $400 in the week of 17 August, taking 2027 to $5,400–5,600 from $5,800–6,000 — a house view moving as a unit rather than a re-dating of the near term. Every other 2027 move ran upward. Citi holds $5,000 on its six-to-twelve-month window, which now reaches into the middle of next year. Morgan Stanley set out a path above $5,000 in 2027 on 20 August, on the reasoning that the fourth-quarter level had arrived early. Commerzbank carries $5,200. HSBC’s markers stand at $5,025 for end-2027, with $5,200 and $5,300 for 2028 and 2029, and State Street’s $5,000 base case runs into early 2027.
Set Wells Fargo’s range aside and the remaining 2027 levels cluster between $5,000 and $5,200 across publishers who disagree by as much as $740 on 2026. Bank of America’s extreme-demand scenario of $8,000 by 2027 stays on record as a scenario, and is the only figure in the register outside that cluster.
Some of that clustering is an artefact of distance. A level eighteen months out has not been tested by anything, and the desks that cut 2026 hardest — Goldman, JPMorgan — have published no 2027 replacement in available reporting, so the cluster is measured across the publishers who chose to write one. Where 2026 and 2027 both exist for one publisher, meanwhile, the pair encodes a rate path rather than two independent forecasts. Goldman’s $4,900 sits ahead of easing that starts in June 2027; HSBC’s $4,750 and $5,025 describe a flat run followed by a step. Lift a 2027 figure out of that pairing and the assumption that produced it does not come with it.
Outlook season re-dates this section before it re-dates any other: the annual 2027 notes land across the fourth quarter, and each will replace a row here.
What re-dates each row
With the August payrolls print behind it, three things now replace figures on this page.
The 11 September CPI. It is the last scheduled reading before the meeting, and it acts on the rate assumptions in the register before it acts on any gold level. Waller has said as much directly: he leans toward holding in September if the August inflation data confirm continued progress, and toward a hike if it does not.
The 16 September FOMC. It resolves pricing that has moved between 36% and 63% since the start of August, and it resolves it for the near term only. A hold with a hawkish statement and a hike with a neutral one are different inputs to the paths underneath these levels, and neither matches the count Bank of America is carrying.
The next note from each desk, and the next consensus collections. Both the LBMA survey at $4,742 and the Reuters poll median near $4,916 were collected before the June–July round and describe a field that no longer exists; their next print will be the first consensus measurement taken after August’s two-way round. Individual desk notes supersede a single row rather than the field, and outlook season concentrates them into the fourth quarter.
Beyond that calendar, two rows carry resolution dates of their own. JPMorgan’s $4,300 Q3 average closes on 30 September. Citi’s near-term number re-dates continuously, since a zero-to-three-month window written on 24 August is a different window by October.
Reading a dated forecast
Four attachments make a level usable in an internal document: the publisher, the note date, the horizon, and the direction of the last revision. The first three were sufficient through July, when every recent move was a cut and direction could be inferred from date alone. August ended that. Across the five moves that reached the field between early July and the end of August, two were reductions, two were increases, and one recorded that the market had overtaken a standing number — while Bank of America’s July cut replaced a circulating year-end figure with an average on a different basis, and the superseded number went on circulating.
Most of the remaining work falls on the horizon attachment, because the register holds four incompatible objects. Year-end and quarter-end markers measure against a print. Averages do not. Rolling windows re-date themselves and belong to no calendar quarter at all. Ranges and scenarios are a fourth kind: HSBC’s $3,800–4,700 band, Wells Fargo’s $4,900–5,100, and Bank of America’s $8,000 extreme-demand case are not comparable to a point estimate and are not comparable to each other. Stack all four in one column and the resulting spread means nothing.
Underneath the levels sits the data they are written against, and this month supplied the demonstration there too. July payrolls printed at a loss of 23,000 on 7 August, moved September-hike pricing from about 58% to 44% in a session, and were read across the market as evidence the tightening case had weakened. On 4 September the Bureau of Labor Statistics revised that month to a gain of 21,000. A figure that repriced a policy expectation by fourteen points was withdrawn and replaced within four weeks, and any document still quoting it is quoting a number the publisher no longer stands behind — the same failure the four attachments are meant to catch, one layer down.
None of the levels above is Golden Ark Reserve’s. This page reproduces third-party research as a dated record; the company publishes no price forecast, endorses none of these, and nothing here is investment advice or a recommendation on timing, suitability or allocation.
Pricing on a defined lot is a separate object from any of it. A proposal on specific bars runs through physical gold purchase and is priced by executable quote at contract — a figure that binds on named serials at a stated moment, with no revision history and no horizon.
Sources
Bank notes and revisions
- Citi near-term target raised to $4,800, 24 August 2026 (Reuters) — zero-to-three-month target to $4,800 from $4,500, six-to-twelve-month held at $5,000. Prior sequence: 0–3 month cut to $4,000 from $4,300 on 9 June (Kitco), restored to $4,500 in mid-June. Levels reconfirmed 3 September.
- Wells Fargo Investment Institute revision (TheStreet, week of 17 August 2026) — year-end 2026 to $4,900–5,100 from $5,300–5,500; 2027 to $5,400–5,600 from $5,800–6,000; identified as the third downward revision of 2026; February range of $6,100–6,300 set with gold near $4,961. The intermediate revision is undated in available reporting.
- Morgan Stanley, 20 August 2026 (Seeking Alpha) and Dow Jones wire via Yahoo Finance — Amy Gower on gold reaching the bank’s Q4 forecast of $4,450 faster than expected, with a path above $5,000 in 2027 and scope for volatility. April cut of the second-half target to $5,200 from $5,700 attributed to Morgan Stanley Commodities Research. Gower’s title from Morgan Stanley Research.
- Bank of America 2026 average revision (8 July 2026) — 2026 average cut 14% to $4,360 from $5,093, hawkish Federal Reserve cited, $5,000 retained as reachable after the tightening cycle; desk under Michael Widmer. Three-hike 2026 base case via Kitco (13 July 2026); distribution across meetings not published.
- Goldman Sachs year-end revision, 19 June 2026 — end-2026 to $4,900 from $5,400; first expected cut moved to June 2027 (Bloomberg wire via Yahoo Finance).
- JPMorgan Q3/Q4 revision, 3 July 2026 — $4,300 Q3 average and $4,500 Q4, replacing a path issued 9 June (Reuters wire; primary note not publicly available). The superseded June level is not stated in this report and is omitted here.
- HSBC forecast revision, 9 July 2026 — 2026 average to $4,560 from $4,864 and 2027 average to $4,925; year-end markers of $4,750 and $5,025 held, 2028–2029 at $5,200 and $5,300; $3,800–4,700 trading band for the remainder of 2026 (Reuters wire).
- UBS twelve-month view of $5,200 — UBS Chief Investment Office, carried 20 August 2026; end-2026 target cut to $5,500 from $5,900 in May, attributed to UBS Global Research.
- Commerzbank — $5,000 for 2026 against $4,400 previously, $5,200 for 2027, carried in a Reuters analyst forecast compilation rather than a dated house note.
- State Street Global Advisors, Monthly Gold Monitor, July 2026 — $5,000 base case into early 2027, as carried in market press.
- LBMA analyst survey averaging $4,742 and a Reuters poll of 31 analysts with a 2026 median near $4,916 — survey publications collected before the June–July round.
- Standard Chartered — omitted pending primary confirmation. A reported 3 August revision of the Q4 2026 average to $4,650 appears only in a secondary forecast compilation and states a prior figure of $4,500, against the $4,750 fourth-quarter level reported for the bank in December 2025 and quarterly averages of $4,605 and $4,850 published in April.
- Deutsche Bank — omitted pending primary confirmation; levels conflict across press reports.
Price path
- Gold after the August payrolls release (Reuters via CNBC, 4 September 2026) — spot down 2.2% to $4,376.04; December futures down 2.4% to $4,428.80; on pace for a weekly decline of about 1%.
- Gold ahead of the release (Reuters, 4 September 2026) — spot at $4,477.10 at 0211 GMT; a 2% rise on 3 September.
- Jackson Hole market reaction — CNBC (28 August 2026) — spot 2.75% lower at $4,474.45; September-hike pricing to 56% from 36%; the 25 August intraday high of $4,696.18; approximately 80% priced for a hike by December.
- Trading Economics — Gold (accessed 3 August – 4 September 2026) — the 3 August close at $4,038, the August path, and the three-week low near $4,330 on 2 September.
- August monthly gain of roughly 10% on a month-on-month basis, with spot near $4,429 on 31 August. Month-to-date readings ran higher intramonth, near 13–15% around the 25 August peak; a 14% figure and a “strongest month this century” characterisation circulate in some coverage and are not used here.
- Record high of $5,586.20 on 29 January 2026 (UBS spot basis; some feeds record a higher print).
Rate pricing and data
- US Bureau of Labor Statistics, The Employment Situation — August 2026 (released 4 September 2026) — nonfarm payrolls up 162,000; unemployment 4.1%; average hourly earnings up 0.3% to $37.75 and 3.1% over the year; July revised from −23,000 to +21,000 and June from +20,000 to +31,000, a combined 55,000 above previously reported figures.
- Consensus for the August report: 53,000 (Dow Jones) and 56,000 (Reuters poll of economists).
- CME FedWatch — September-hike odds to about 44% from 58% after the July payrolls report on 7 August; 36% before Jackson Hole and 56% after it on 28 August; near 60% at the end of August; 63.2% on 2 September, following remarks that day from New York Fed President John Williams; 50.2% on 3 September, after Governor Christopher Waller said he leans toward holding in September if August inflation confirms continued progress; back above even after the 4 September payrolls release.
- Scheduled: US CPI for August, 11 September 2026; FOMC decision, 16 September 2026.
Demand
- World Gold Council — Gold Demand Trends Q2 2026 (30 July 2026).