
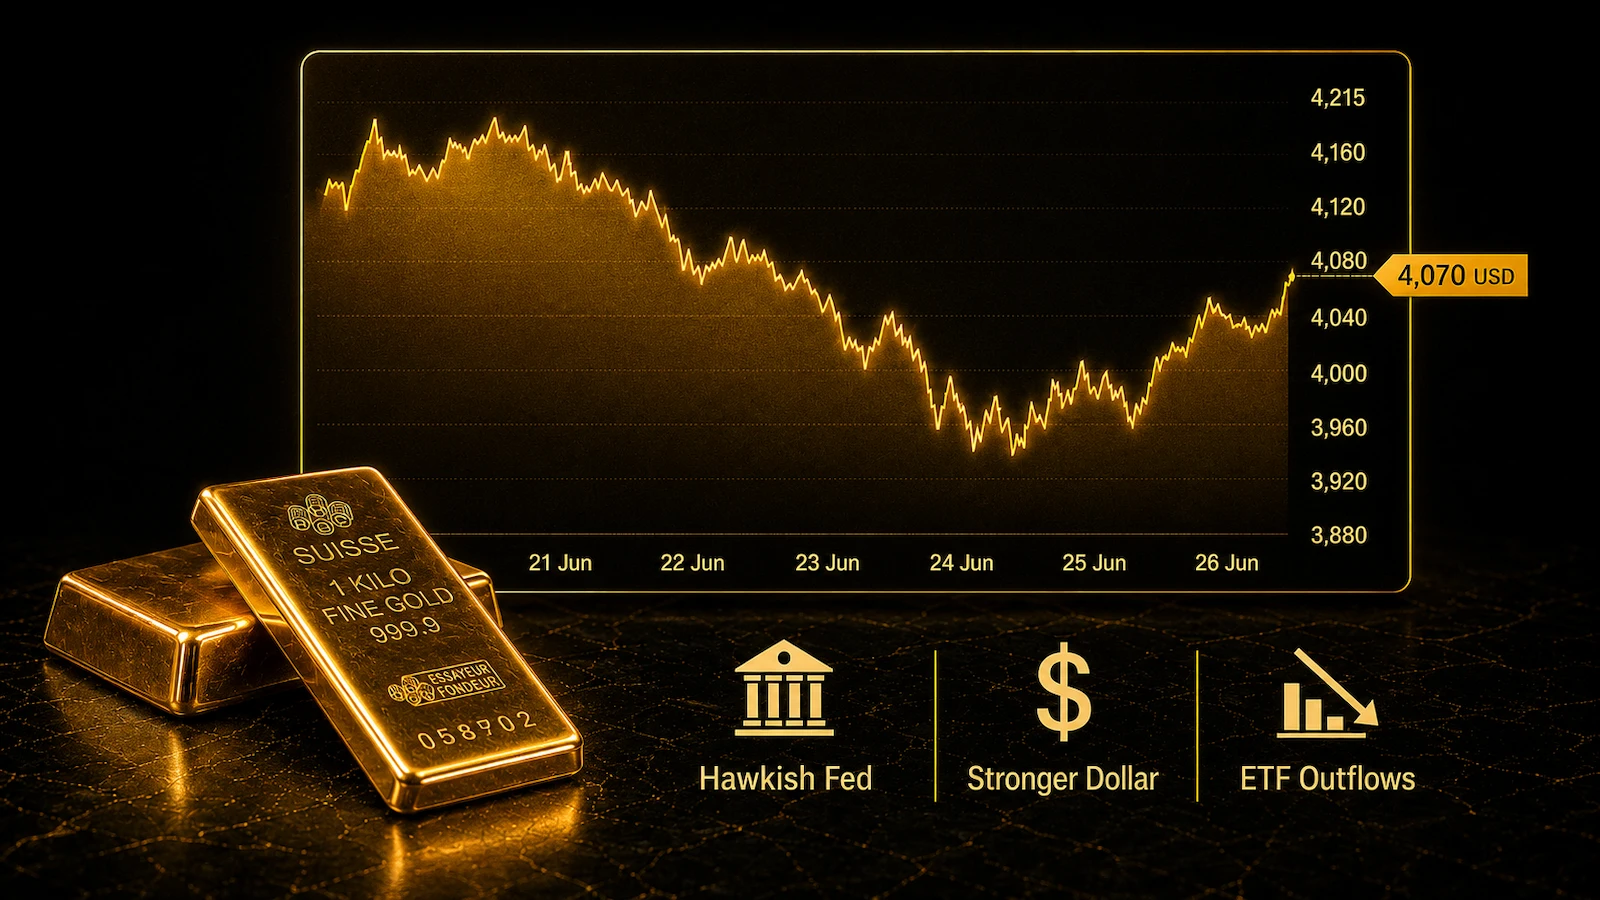
Gold fell for a fourth straight week into 27 June 2026, trading near $4,070 an ounce after dropping below $4,000 midweek for the first time since November 2025 and touching a seven-month low. The decline tracked the U.S. rate path almost one-for-one. Markets now read the Federal Reserve as more likely to raise than to cut, and the dollar reached its strongest in over a year; the safe-haven premium built up earlier in the year drained out as the Strait of Hormuz partially reopened and crude retreated toward pre-conflict levels. A Friday bounce of about 1%, after Thursday’s inflation print trimmed rate-hike bets at the margin, pared the loss without reversing the trend. For a counterparty sizing a physical position, the level matters less than its distance from where the analyst field still sits — a gap a hawkish Fed has widened through June.
Where XAU/USD trades now
By Friday’s close on 26 June 2026, spot gold traded near $4,070 an ounce, having spent three sessions pinned around $4,000. Wednesday’s session had pushed the price under that figure for the first time since November 2025, as the dollar climbed to a one-year high, before a partial recovery on Friday as the currency eased. Reuters and Kitco put the week’s decline at roughly 2.5%. That marked a fourth consecutive weekly fall — the longest losing streak since January’s record of $5,595.
That figure is indicative: delayed, rounded, and aggregated from third-party market data rather than a dealing price, with any spread and premium settling on top of spot. How the reference itself is built differs by venue — the London over-the-counter market, the COMEX futures exchange, and the daily LBMA benchmark each set a different part of the number that reaches a screen.
Why gold fell this June
At the center of the week’s decline sat a repricing of Federal Reserve policy. Having held its benchmark at 3.50–3.75% through the spring, the central bank now faces a market that prices further increases rather than the cuts it had penciled in at the start of the year. CME FedWatch — CME Group’s tool, which reads rate-move odds from fed funds futures — showed roughly a 60% chance of a September hike late in the week, down from about 64–69% earlier, with a quarter-point December move near 40% and one reading carrying no cut at all for 2026. Higher policy rates lift the opportunity cost of holding a non-yielding asset, and gold absorbed the adjustment.
A rising dollar did the rest. With the U.S. dollar index at its strongest in more than a year and headed for a second straight weekly gain, gold grew more expensive for buyers settling in other currencies. Thursday’s data complicated the picture without breaking it: the Personal Consumption Expenditures price index, the Fed’s preferred inflation gauge, rose 4.1% in the year to May, matching the Reuters poll, with the core rate at 3.4%. Hot enough to keep the hike narrative intact, the print still landed in line with forecasts, which let the dollar slip and gold recover about 1% on Friday. These same forces have driven the move since the January peak, traced in detail under why gold is falling.
Two further pressures sat underneath. Exchange-traded-fund demand turned negative, with Goldman Sachs’s commodities-research desk flagging the first monthly outflow from Asian gold ETFs since August 2025 — a bid that had supported the price through 2025, now reversed. Meanwhile the geopolitical premium unwound: an interim U.S.–Iran agreement and a partial reopening of the Strait of Hormuz pulled crude oil down roughly 30% from its late-May highs, draining the safe-haven flows that had lifted gold during the spring conflict. A reported attack on a cargo vessel in the strait late in the week kept the risk two-sided, though it did not restore the premium.
The short-term view
Near-term commentary centered on the dollar and the rate path rather than on gold’s own fundamentals. An analyst at Saxo Bank described sentiment as shaken by the selloff, with the metal caught between a hawkish Fed and a firm dollar; an analyst at OANDA attributed the drift lower to the speed of the hawkish repricing and the dollar momentum it generated. Both framings make the September Fed meeting and the next inflation prints the proximate catalysts, with $4,000 the level the market is now defending.
On the annual horizon the field still sits above the current level. The Reuters poll of analysts carries a 2026 median near $4,916, above Friday’s close, and the standing bank targets run higher still. The standing year-end calls and the demand behind them are set out in the gold price forecast for 2026–2027, together with the conditions that would break the trend. The distance between this week’s price and those targets is where any return or drawdown is located, and which macro path runs decides it.
Against the 2026–2027 analyst targets
Across the major banks, year-end 2026 calls cluster between roughly $4,800 and $6,300 — a band wide enough that the field agrees on direction and divides on magnitude. JPMorgan’s research desk sits at the top, near $6,000 for the fourth quarter; Morgan Stanley holds the most measured major call, around $4,800. This week, the range moved. Goldman Sachs cut its year-end 2026 target to $4,900 from $5,400 on 20 June, attributing the reduction to fading ETF inflows and the removal of the remaining 2026 rate cuts from its forecast, with easing pushed into 2027 — the same hawkish-Fed logic that drove the weekly tape.
Underneath those targets lies the structural bid the bulls cite: the official sector. The World Gold Council, the gold industry’s market-development body, recorded central-bank purchases of about 850 tonnes in 2025, a pace that cooled into early 2026. For a treasury, family office, or trading counterparty, the practical question is the price at which a physical position is opened relative to that field; the indicative quote, the bar format, and the spread settle at the point of transaction. Counterparties evaluating a physical allocation can buy physical gold through Golden Ark Reserve against the current indicative reference.