
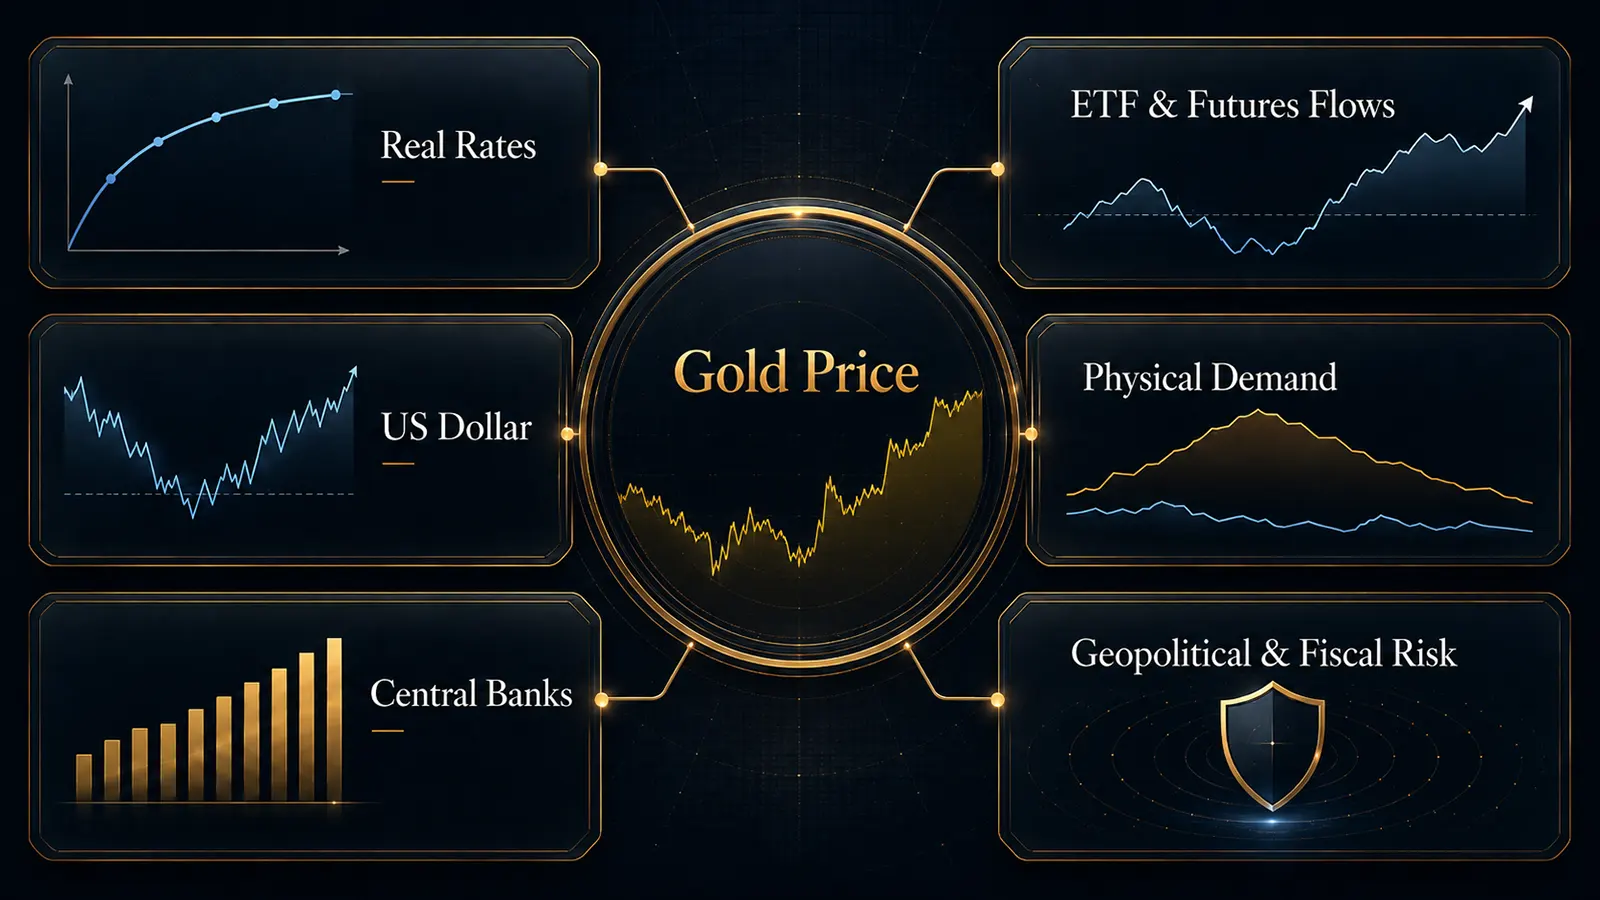
A gold price move reaches a treasury desk or an investment committee as an attribution problem: the same weekly change can trace to a real-yield repricing, an official-sector purchase programme, or an ETF liquidation, and each cause carries a different implication for holding, hedging, or settling a physical position. Since 2022 the attribution has become harder — the real-rate model that explained most of gold’s price variance for two decades now explains almost none of it, while central bank purchases and investment flows set the marginal price. The price those drivers act on forms in the London OTC market and COMEX futures, the two venues that carry most of global gold turnover. Read together, the six drivers mapped here define the regime the gold price trades in — the layer any price view is built on.
Real interest rates: the opportunity-cost anchor — and where it broke
How the inverse relationship works
Gold pays no coupon, and holding it carries cost — vault, insurance, transport. The return an owner forgoes is measured against the yield available on assets with no credit risk, and the standard proxy is the 10-year US Treasury Inflation-Protected Securities (TIPS) yield: the real, inflation-adjusted rate. Research from the Federal Reserve Bank of Chicago — a research arm of the US central bank system — formalises the logic: gold trades as a long-duration real asset, so its price carries a strong inverse relationship to long-term real interest rates. Each basis point of additional real yield raises the cost of carrying a non-yielding position; each basis point of decline lowers it.
Through 2021 the channel was tight enough to build models on. RBC Wealth Management, the advisory arm of Royal Bank of Canada, puts the correlation (R²) between the gold price and the 10-year TIPS yield at 69% for 1997–2004 and 84% for 2005–2021; PIMCO, one of the world’s largest bond managers, treated real-yield changes as the single most significant explanatory variable for gold over that period. In practice a treasury could compress its gold view into one observable market rate: the TIPS curve set the fair-value estimate, the hedge ratio, and the committee narrative at once.
The 2022 break
2022 stress-tested the model, and the model failed. Ten-year real yields rose roughly 250 basis points that year — the largest annual increase on record against a prior maximum near 150 — while the dollar gained more than 8%; gold still closed the year with a small gain, per the World Gold Council, the industry body whose supply-and-demand statistics serve as the market’s standard reference. A regression estimated on the previous two decades maps that rate-and-dollar combination to a deep drawdown, and the drawdown did not occur.
The break persisted. RBC Wealth Management measures that R² at 3% for 2022–2023 and about 7% since 2024. The World Gold Council records real rates holding above 2% while the price kept rising, the inverse correlation counterweighted by risk-mitigation demand and central bank buying; PIMCO attributes the decoupling to record official-sector purchases — driven in part by reserve diversification away from the dollar — and to safe-haven investment flows that proved sticky.
The operational consequence: real yields still transmit at short horizons — a repricing of rate expectations moves the quote the same day, and the channel reasserts when flow drivers go quiet — but the level of the price is no longer anchored to the TIPS curve. A fair-value model estimated on pre-2022 data now surfaces a large, persistent residual; that residual is the structural bid, and flow statistics are where it becomes observable. A desk still marking gold off real yields alone mis-attributes moves and mis-sizes hedges.
The US dollar: denomination and the FX leg
The global reference price is a dollar quote: the London OTC market and COMEX both price gold in US dollars per troy ounce, and every other currency’s gold price is a conversion. That gives the dollar two distinct transmission channels. The first is mechanical: dollar strength raises the local-currency cost of an unchanged dollar quote for every non-dollar buyer and compresses marginal demand; dollar weakness does the reverse. The 2022 episode shows the channel operating alongside rates — gold absorbed an 8% dollar gain in the year of the record real-yield rise — while in 2025 the World Gold Council lists dollar weakness, together with falling Treasury yields, among the drivers of record investment inflows.
For a euro- or franc-reporting entity, the second channel sits inside its own accounting: the holder books the dollar gold return plus the currency move, so the same dollar rally can post as a flat mark in euro terms, and a flat dollar price can post as a gain when the dollar strengthens. The gold decision and the currency decision are separable — FX-hedged gold products exist for exactly this split, and demand for them rose in Switzerland when the local currency appreciated against the dollar. A treasury that has not decided which leg it wants to carry ends up carrying both by default.
Physical transactions inherit this structure. A bar purchase prices off the dollar benchmark even when settlement and delivery occur elsewhere; regional premiums and discounts sit on top of the converted quote. For a non-dollar counterparty the entry cost of a physical position moves with two markets at once, and attribution matters before action: a gold rally in euro terms can be mostly a currency move, and hedging the wrong leg locks the wrong exposure.
Central bank purchases: the structural bid since 2022
Official-sector demand is what separates the current price regime from every earlier one. The World Gold Council’s series shows a step change:
| Period | Net official-sector purchases |
|---|---|
| 2010–2021 | 473 t per year, average |
| 2022 | 1,136 t — the largest annual total in records going back to 1950 |
| 2023 | 1,051 t |
| 2024 | 1,045 t |
| 2025 | 863 t — the fourth-largest on record |
Scale matters more than the year-to-year path. Newly mined supply ran at roughly 3,670 t in 2025 — itself a record — so official purchases have absorbed around a quarter or more of annual mine output every year since 2022. The bid is also one-sided: reductions stayed rare and small, with the largest reported cut of 2025 at 15 t. A buyer cohort that takes a quarter of new supply and returns almost none of it changes how the market clears.
Twenty-two institutions added a tonne or more in 2025 — a breadth that makes the bid structural rather than the programme of one balance sheet. The National Bank of Poland was the largest buyer for the second consecutive year, adding 102 t to reach 550 t — 28% of its reserves — and raised its target allocation to 30%. The People’s Bank of China reported additions in every month of the year, lifting holdings to 2,306 t, still under 9% of its reserves. Kazakhstan posted its largest annual purchase on record; Brazil returned to the market after a four-year absence and added 43 t between September and November.
Visibility is partial, and that has a direct analytical cost. Reported figures flow through IMF statistics and central-bank disclosures, but the World Gold Council’s estimate of total official demand consistently exceeds what identified reporters account for — for 2025, roughly 57% of estimated purchases could not be attributed to a disclosed buyer. Monthly official statistics therefore understate the bid in real time, and quarterly estimates revise history after the fact. A desk attributing a price move on the day cannot see this driver directly; it surfaces in the data weeks to months later.
In 2025 the bid proved price-aware without being price-defeated. Purchases fell 21% year on year while the price set 53 record highs — official buyers stepped back as valuations ran — yet the fourth quarter was the strongest of the year at 230 t, executed at record price levels. The World Gold Council’s 2025 reserve survey, drawing 73 central-bank responses — its broadest sample since the survey began — found 95% expecting global official gold holdings to rise over the following year and 43% planning additions of their own. Stock levels already reflect the shift: by the European Central Bank’s 2025 assessment, gold at market value had passed the euro to become the second-largest reserve asset globally, behind only the dollar. Fifteen consecutive years of net accumulation, survey intent, and rising reserve share point the same direction — behaviour consistent with gold’s function as a strategic reserve asset, on a horizon measured in years.
What this bid changes most is market structure. The residual from the rates section now has a source: a large, persistent, partially invisible bid under the market is precisely what a pre-2022 fair-value model cannot see, and it is the main reason such models now run a standing error. The deeper shift is in how drawdowns resolve — weakness meets an absorbing buyer whose decision horizon does not reference the week’s price action.
Investment flows: ETFs and futures positioning
Physically backed gold ETFs hold allocated Good Delivery bars; share creations pull bars into fund custody and redemptions release them. The flow is direct physical demand, measurable weekly and published monthly by the World Gold Council — which makes this the most observable driver in the set, and the one that translates Western portfolio decisions into metal.
2025 was the channel’s largest year on record: US$89bn of net inflows, with holdings rising 801 t — a tonnage gain second only to 2020. North American funds took US$51bn, close to 57% of the global total; Asian funds added US$25bn, more than all their prior years combined; European funds turned two years of outflows into US$12bn of inflows. Collective holdings ended near 3,930 t, an all-time month-end high, and assets under management more than doubled over the year. For contrast, the 2024 monthly average inflow was US$292mn — the 2025 pace ran an order of magnitude above it.
At the turn of 2026 the channel measured its own amplitude, in both directions: a record monthly inflow of US$18.7bn in January, the strongest two-month start on record through February, then a record monthly outflow of US$12bn in March that cut first-quarter net inflows to US$12bn. Same funds, same mechanics, opposite sign, weeks apart.
Three forces, per the World Gold Council, acted together behind the 2025 inflows: safe-haven allocation amid trade and geopolitical tensions, momentum buying as the price set successive highs — inflows and price reinforcing each other — and falling opportunity cost as Treasury yields declined and the dollar weakened. In other words, the rate and currency channels from the first two sections cash out here: when they turn supportive, this is the flow data they show up in.
Futures positioning is the faster, leveraged layer, and it moves independently of holdings. Managed-money net length in COMEX gold — tracked through positioning reports of the CFTC, the US derivatives regulator — ended 2025 roughly 30% below its end-2024 level even as ETF inflows set records; futures open interest peaked in October 2025 at its highest since 2013. Positioning and holdings are different populations: one reprices in days and carries leverage, the other records allocation. Attribution needs both — a move driven by positioning alone registers in price without accumulating in holdings data, while an allocation shift leaves a durable trace in the flow statistics.
The operational read: two-thirds of US gold demand in 2025 was ETF demand — US-listed funds alone added 437 t, lifting their holdings to a record 2,019 t — so the marginal Western buyer is the fund channel, and Western demand appears in flow reports before it appears anywhere in the physical market’s own signals. Those physical signals are the next driver.
Physical demand and regional premiums
Most gold turnover is financial — the London OTC market and COMEX clear multiples of annual mine output in days — but the physical layer prints its own data, and 2025 showed both of its faces at once. Bar and coin purchases reached a twelve-year high, while jewellery volumes contracted under successive record prices, the expected response of the price-elastic segment. Total demand including OTC activity exceeded 5,000 t for the first time in the World Gold Council’s records, worth some US$555bn. The composition matters for attribution: investment-motivated physical buying held through record prices; consumption-motivated buying gave way.
Supply cannot arbitrate these shifts on any horizon a desk works with. Mine production set a record near 3,672 t in 2025, yet total supply grew only 1% — new capacity takes years to develop, and recycling, the faster-responding component, is bounded by the stock of metal holders are willing to release. Price therefore clears demand shifts against a nearly fixed short-run supply, which is why the demand-side drivers in this article carry the explanatory weight.
Where physical tightness sits geographically is read from regional premiums: the spread between a local physical price and the benchmark spot quote. Import quotas, duties, licensing, and logistics slow the arbitrage that would close the spread, so a regional imbalance persists as a measurable number instead of clearing instantly — and policy can reprice the wedge overnight, as when India’s July 2024 union budget cut the gold import duty from 15% to 6% and reset the local price level in a day.
The recent Chinese arc shows the signal’s range. On the Shanghai Gold Exchange — China’s physical-delivery gold venue, operating under central-bank oversight — the premium over the international quote historically runs $5–15/oz around a mean near $6. In September 2023 it set a record high when an import-permit suspension collided with strong domestic demand; per CME Group, operator of the COMEX futures exchange, the spread then held a $20–50 range into early 2024 before returning to its mean by August as demand cooled — exchange withdrawals fell from their largest-ever monthly load-out of 271 t in January 2024 to under 90 t by mid-year, and the premium followed. Through 2025 that spread flipped to discounts even as the global benchmark set records, printing regional demand weakness directly; India moved the opposite way over those months, with local premiums reaching $7/oz ahead of the festival season — the highest since November 2024, per Reuters — while local prices stood at all-time highs.
Read against the benchmark, the premium series settle questions flow data leaves open. A sustained premium over a flat benchmark establishes regional physical tightness; a discount under a rising benchmark establishes the opposite with equal precision. And because a physical position transacts at benchmark plus spread, the comparison also identifies whose demand is moving the market — Western portfolio demand printing in fund flows, or Asian physical demand printing in the spread itself.
Geopolitical and fiscal hedging demand
Hedging demand references balance-sheet security rather than yield or price, and it rests on properties specific to the asset. Gold is no institution’s liability: it has no issuer and no counterparty; its existence depends on no payment or settlement infrastructure. Held in allocated physical form, it is the one reserve asset whose value does not require another balance sheet to perform.
In 2022 those properties acquired a price: foreign-held reserve assets of a central bank were immobilized by the jurisdictions where they were booked. The mechanism, not the episode, is what changed reserve management. Conventional reserve assets carry custody-jurisdiction risk that activates precisely in the scenarios reserves exist to cover. PIMCO attributes part of the record official-sector accumulation since then to diversification away from that exposure, and the World Gold Council’s reserve surveys record the motive set consistently — diversification, performance in crisis periods, and gold’s standing as a politically neutral asset. The structural bid documented in the central-bank section has a structural reason.
The episodic layer arrives faster. Trade disputes and political uncertainty produce step increases in hedging allocation, as does financial-market stress, and the pattern is documented across cycles: the three strongest years for gold ETF demand on record — 2009, 2020, and 2025 — each coincided with a period of acute global stress, per the World Gold Council. Timing is largely unforecastable; the demand registers as the flow and premium prints described in the two preceding sections, usually within days of the triggering event.
The fiscal layer is slower and currently the more consequential for the rates model. BlackRock, the largest asset manager globally, frames mounting government debt as a store-of-value driver for metals, citing US federal debt above 120% of GDP and annual deficits near 6–7% of GDP; World Gold Council commentary links those fiscal concerns to bond-market volatility and reallocation toward alternative safe-haven assets. This is the mechanism that lets gold and long-term yields rise together: when the yield rise itself expresses the risk being hedged, higher yields stop functioning as gold’s opportunity cost. Attribution therefore has to distinguish a yield move driven by growth from one driven by fiscal risk — the two carry opposite implications for the gold price.
Reading the drivers together: regimes, not a formula
No fixed weighting scheme combines the six drivers into a price model, because the weights themselves are what shift. Before 2022 one variable did most of the work: real yields explained the bulk of price variance, and the remaining drivers modulated around that anchor. Since 2022 the market trades in a multi-driver regime. A structural official-sector bid that does not reference yields is overlaid by investment flows running an order of magnitude above their prior rate, while hedging demand can invert the sign of the rates channel altogether. Every fair-value estimate is implicitly a claim about which regime is operating; models that hard-code the old one now carry a standing error, which is the measurable content of the 3% correlation figure from the rates section.
When the price is rising, or holding at levels earlier models mark as stretched, the structural answer is alignment: several drivers pulling the same direction with none large enough to offset. 2025 is the documented case — a weakening dollar and falling Treasury yields cutting opportunity cost, record ETF inflows, a fourth consecutive year of official-sector purchases above 800 t, and safe-haven allocation through repeated stress episodes. The combination produced 53 record highs and a 44% rise in the annual average price. “Why is gold high” resolves into “which drivers are aligned, and in which data series is each one visible” — flow reports and regional premiums on the fast side, reserve statistics in arrears — not into a single macro variable.
That structure runs in reverse. When drivers offset — investment outflows against an absorbing official bid, a firming dollar against stable holdings — the price stalls rather than trends; when several turn together, the move is fast, because the flow channel amplifies both directions, an amplitude the first quarter of 2026 measured within twelve weeks. The driver-by-driver anatomy of the 2026 correction is a separate analysis; the mechanics are the ones documented here with the signs reversed.
Attribution on any given move follows the order in which the data arrive. Rates and the dollar reprice the quote intraday. Futures positioning follows weekly through CFTC reports; ETF flows print weekly and consolidate monthly; regional premiums update daily and localize physical tightness. Official-sector figures arrive monthly, understate the bid in real time, and revise for quarters — roughly half of it never visible on the day. A same-day attribution is therefore provisional by construction, and a desk that treats the first available explanation as the final one will systematically over-credit the fastest-printing drivers.
What the drivers do not produce is a forward number. Translating the regime into price levels is the work of bank research desks, and their current levels are consolidated in bank targets for 2026–2027; those targets are conditioned on the drivers mapped above. For a physical position the operational surface is narrower: the executable price is the benchmark plus the regional spread, and entry and exit run through the flow and premium environment already documented — attribution of the move being settled into stays a data exercise before it becomes a narrative one. What persists across episodes is the regime itself — a price set by drivers whose relative weights shift rather than by one macro variable, so any forward view, from whichever desk, is ultimately a position on which regime holds.
Sources
- World Gold Council — Gold Demand Trends (Q4 and Full Year 2025), gold ETF holdings and flows reports, central bank gold statistics, Central Bank Gold Reserves Survey 2025, gold market commentary
- Federal Reserve Bank of Chicago — Chicago Fed Letter, “What Drives Gold Prices?”
- RBC Wealth Management — “Gold’s regime change?” (gold vs 10-year TIPS correlation series)
- PIMCO — “Understanding Gold Prices”
- CME Group — OpenMarkets analysis of the Shanghai gold premium
- CFTC — Commitments of Traders positioning reports
- European Central Bank — assessment of gold in official reserve assets (2025)
- IMF — official reserve statistics
- BlackRock — precious metals market commentary
- Reuters — India physical market premium reporting