Gold Price Forecast to the End of 2026: Bank Targets
Gold price forecast to the end of 2026: where major banks see gold at year-end and in 2027, what changed in October, and the Fed decisions still ahead.
In this article
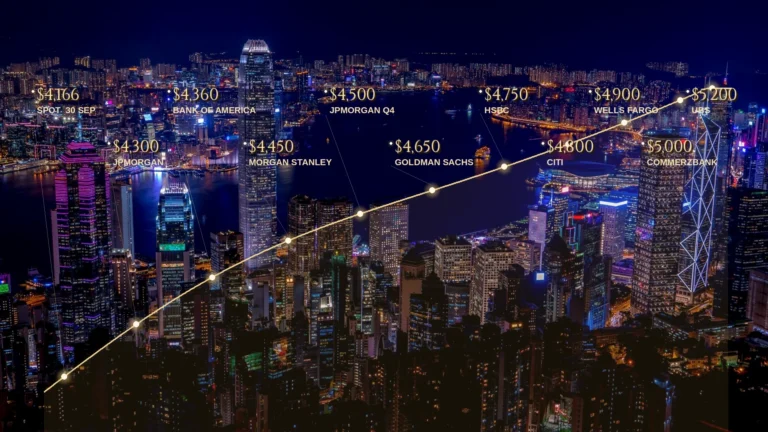
Gold closed the week to 23 October just below $4,000 an ounce, its lowest close since mid-July. Every published bank forecast for the end of the year sits at or above that price, and most of the banks see gold higher again in 2027. Over the past month several of them have lowered their forecasts for the coming months, and most point to the same pressure: US interest rates. Gold pays no interest, so when rates rise, holding it costs more — and the Federal Reserve, the US central bank, still has two rate decisions to make before the year is out. Below, each bank’s forecast is set out with the date it was made, alongside what has changed since the October edition.
Where bank forecasts stand for the end of 2026
The table shows each forecaster’s latest published view, from lowest to highest, against gold’s closing price of $3,993.96 on 23 October. All prices on this page are indicative reference prices: delayed, rounded figures from third-party market data; none is a price at which gold can be bought or sold.
| Forecaster | Forecast | What the figure covers | Published | Change from the previous forecast |
|---|---|---|---|---|
| HSBC (London-based bank) | $4,490 | Average for the whole of 2026 | 1 Oct | Down from $4,560 |
| JPMorgan (US bank) | $4,500 | Average for October–December 2026 | 3 Jul, as reported in the press | Down from $6,000 |
| CIBC (Canadian bank) | $4,500 | October–December 2026 | 20 Oct, as reported | Down from $6,500 at the start of the year |
| Commerzbank (German bank) | About $4,500 | Price at the end of 2026 | 28 Jul | Down from $4,800 |
| UBS (Swiss bank) | $4,600 | Price in December 2026 | Late July, repeated in October | Unchanged |
| Goldman Sachs (US investment bank) | $4,650 | Price at the end of 2026 | 18 Sep | Down from $4,900 |
| State Street (US asset manager) | $4,750–5,500 | Main scenario for the end of March 2027, now rated 60% likely | October monthly report | Likelihood cut from 70% |
| Citi (US bank) | $4,800 | Price within three months of the note, to late November | 24 Aug | Up from $4,500 |
| Wells Fargo Investment Institute (research arm of US bank Wells Fargo) | $4,900–5,100 | Price range at the end of 2026 | Week of 17 Aug | Down from $5,300–5,500, the third cut this year |
Forecasters measure different things. Some forecast the price on a set date, such as the end of the year. Others forecast an average over a period, such as October to December or the whole of 2026. A whole-year average includes the higher prices of the first half of the year, so it does not compare directly with a year-end price.
Over the summer, Commerzbank lowered its year-end forecast twice, most recently on 28 July. UBS has worked from a schedule of targets since late July, with $4,600 for December and higher levels through 2027. The October edition carried older figures for both rows.
Left out of the table, as in earlier editions, are Germany’s Deutsche Bank and the UK-based Standard Chartered, because the latest forecasts reported for them contradict each other. Press reports of the July note from JPMorgan supply its figures, since the bank’s own research page still shows the forecast it published in June.
What happened in October
October opened with weak US jobs data. Employers added only 29,000 jobs in September, and the figures for the two previous months were revised lower. Gold rose briefly on the report, but a firmer dollar and high US government bond yields pulled it back, and it ended the first week lower.
On 7 October the published record of the Fed’s September meeting showed that most officials expected one more rate increase before the end of the year. A week later the consumer price index, the main US measure of inflation, showed prices 3.7% higher than a year earlier, above economists’ expectations, with gasoline accounting for more than half of September’s rise. On 16 October Kevin Warsh, who chairs the Fed, declined to say what the central bank would do next.
The week to 23 October was gold’s weakest since June. Oil climbed to its highest price since May, which kept expectations of higher US interest rates in place, and some investors reportedly sold gold to raise cash after losses in technology shares. Gold fell even as the interest rate on 10-year US government bonds eased back toward 5%, and on Friday it closed below $4,000 for the first time since mid-July. Golden Ark Reserve’s gold market analysis follows price, policy and demand in more detail.
Why the near-term forecasts came down
Once the Fed raised its rate in September for the first time in three years, higher bond yields made interest-paying assets more attractive than gold, HSBC wrote on 1 October. Because gold is priced in dollars, a stronger dollar also raises its cost for buyers who pay in other currencies, in the bank’s reading of the market.
Energy prices sit behind the caution of US lender Bank of America, since expensive fuel keeps inflation high and high inflation gives the Fed reason to keep interest rates up. The October outlook from CIBC traces a similar line, from energy costs through inflation to tighter policy at the Fed.
Selling by traders added to the pressure on gold. Most US gold futures trade on COMEX. Speculative funds there cut their positions by the equivalent of 84 tonnes in September, according to the World Gold Council, whose statistics the market treats as its reference. In the council’s judgment, the selling likely contributed to the month’s decline, and UBS’s account of the fall includes it too. Investors in gold funds have so far held on, in what Bank of America calls a “fragile equilibrium” that could deepen a fall if they start to sell.
Near $4,000, by UBS’s reckoning, gold may test a level where long-term buyers would step in. A bottom may be near after further short-term pressure, HSBC added on 1 October.
Converted into probabilities by the FedWatch tool of exchange operator CME Group, interest-rate futures put the chance of an increase on 28 October at about one in ten. An increase at that meeting was the assumption in Goldman Sachs’s September forecast. All 100 economists in a poll by the news agency Reuters, published on 20 October, expect an increase at the December meeting. For 9 December, futures pricing puts an increase at about eight in ten.
Who is still buying gold
Buying has continued while the price fell. The data, by type of buyer:
| Buyer | Latest reading |
|---|---|
| Gold funds (exchange-traded funds that hold physical gold and trade like shares) | A record $31 billion of new money in July–September; holdings at a record 4,256 tonnes at the end of September |
| Central banks | Net purchases of 39 tonnes in August, the latest month compiled; China’s central bank bought for a 23rd straight month in September |
| Buyers in China | Record imports of 1,141 tonnes for consumers in January–August |
| London vaults | Gold stored there rose almost 4% in July–September, to 9,821 tonnes |
Fund buying held up through September, the World Gold Council noted, with European funds, led by those listed in the UK, taking the largest share of the quarter’s inflows.
Beyond this year, several banks build their forecasts on central-bank demand. By Goldman Sachs’s estimate, central banks have recently been buying about 90 tonnes a month, against an average of 17 tonnes a month before 2022. Nearly all of the rise the bank expects through 2027 comes from that buying, in its account. Why central banks hold gold at all is set out in Gold as a Strategic Reserve Asset. A fuller count, including central-bank purchases that are not reported month by month, will come with the World Gold Council’s next quarterly report on demand, covering July to September.
What the banks expect for 2027
Compared with gold’s 23 October price, every 2027 forecast in the table below is higher. Where a forecaster publishes numbers for both years, its 2027 level also sits above its 2026 one.
| Forecaster | Forecast | What the figure covers | Published |
|---|---|---|---|
| HSBC | $4,825 | Average for 2027 | 1 Oct, down from $4,925 |
| State Street | $4,750–5,500 | Main scenario by the end of March 2027, rated 60% likely | October report |
| Commerzbank | $5,000 | A level the bank says is possible in 2027 if inflation pressures ease; no formal 2027 forecast | 28 Jul |
| Citi | $5,000 | Six to twelve months after its August note | 24 Aug |
| Morgan Stanley | Above $5,000 | Second half of 2027 | 29 Sep, strategist on television |
| CIBC | $5,200 | Average for 2027; the bank expects $5,500 for 2028 | October, down from $6,500 for 2027 |
| Wells Fargo Investment Institute | $5,200–5,400 | End of 2027 | 29 Sep, down from $5,400–5,600 |
| UBS | $5,400 | September 2027 | Added in August, repeated in October |
| Goldman Sachs | $5,400 | End of 2027 | Kept through its June and September revisions |
At the annual conference of the London Bullion Market Association, which represents the London gold market, delegates meeting in Sorrento, Italy, on 4–6 October put gold at about $5,013 an ounce a year ahead. The latest quarterly poll of analysts by Reuters, taken in July, put the 2027 average at $4,610; the next poll has not yet been published.
Wells Fargo Investment Institute trimmed its 2027 range on 29 September and raised its forecast for 10-year US government bond yields. Three Fed rate cuts between September 2027 and March 2028 sit in the Goldman Sachs forecast. UBS’s path runs through one more increase this year and then two cuts in 2027. The highest targets, as their authors describe them, rest on continued buying by central banks and on lower US interest rates later on.
How to read a dated forecast
Because every forecast is tied to when it was made and the period it covers, each one eventually meets its date; those in the table below already have. The London benchmark price used below is the LBMA Gold Price, set twice each business day in London.
| Forecast | Made | What happened |
|---|---|---|
| JPMorgan: $4,300 average for July–September 2026 | July 2026 | The quarter has ended. The benchmark price moved between $3,978.55 and $4,663.70 and finished at $4,176.30; the official quarterly average will appear in the World Gold Council’s next demand report |
| UBS: $4,400 for the end of September 2026 | July 2026 | The benchmark price finished September at $4,176.30 |
These dates will bring the next updates before the year ends:
- Fed rate decisions: 28 October and 9 December; the December meeting also brings officials’ updated economic projections.
- US inflation: 29 October for the PCE price index, the Fed’s preferred measure; 10 November and 10 December for consumer prices.
- US jobs: 6 November and 4 December.
- Also due: the World Gold Council’s demand report for July–September and the next Reuters poll of analysts.
None of the forecasts on this page is Golden Ark Reserve’s own. The page records what other institutions have published, with dates and sources; Golden Ark Reserve publishes no price forecast, does not endorse any of these figures, and nothing here is investment advice or a recommendation on when to buy or sell. The price of specific gold bars is set by a firm, executable quote when a purchase is confirmed; a proposal for a defined purchase runs through physical gold purchase.
Sources
Bank forecasts
- HSBC’s 1 October revision (Newsquawk, 1 October 2026) — 2026 average lowered to $4,490 from $4,560; further short-term pressure, with gold possibly nearing a bottom. Detail in TheStreet (4 October 2026) — 2027 average to $4,825 from $4,925; bond yields and the dollar as the reasons.
- JPMorgan’s July revision (Reuters via Kitco News, July 2026) — $4,300 for July–September and $4,500 for October–December 2026. The bank’s own research page still shows its 9 June forecast.
- CIBC’s October outlook (Kitco News, 20 October 2026) — $4,500 for October–December 2026, $5,200 average for 2027, $5,500 for 2028; also reported by Seeking Alpha.
- Commerzbank’s 28 July cut (IndexBox, 28 July 2026) and Canadian Mining Report (30 July 2026) — year-end 2026 to about $4,500 from $4,800; $5,000 possible in 2027 if inflation pressures ease. The earlier June cut to $4,800 from $5,000: TheStreet (5 June 2026).
- UBS’s schedule of targets (investingLive, 3 August 2026) — $4,400 for September 2026, $4,600 for December, $5,000 for March 2027 and $5,200 for June 2027. The extension to $5,400 for September 2027 (Canadian Mining Report, 27 August 2026); the schedule repeated, with rate expectations and futures selling, in Yahoo Finance (11 October 2026); support near $4,000 in Investing.com (23 October 2026).
- Goldman Sachs’s 18 September revision (investingLive, 23 September 2026) — end-2026 to $4,650 from $4,900; $5,400 for end-2027 kept; an October rate increase assumed; three cuts expected between September 2027 and March 2028; central-bank buying near 90 tonnes a month.
- State Street Monthly Gold Monitor, October 2026 — main scenario of $4,750–5,500 by the end of March 2027, likelihood cut to 60% from 70%; record Chinese consumer imports in January–August.
- Citi’s August revision (Reuters via TradingView, August 2026) — three-month target to $4,800 from $4,500; the $5,000 six-to-twelve-month figure as recorded in the October edition.
- Wells Fargo Investment Institute’s August cut (investingLive, August 2026) — year-end 2026 range to $4,900–5,100 from $5,300–5,500. The 29 September update (Foreks, in Turkish) — end-2027 range to $5,200–5,400 from $5,400–5,600; higher forecast for 10-year US bond yields.
- Morgan Stanley’s strategist on CNBC (investingLive, 30 September 2026) and Kitco News (30 September 2026) — $4,000 as a strong floor; a return above $5,000 in the second half of 2027.
- Bank of America’s 30 September outlook (TheStreet, 1 October 2026) — energy costs, inflation and interest rates as the near-term pressure; the position of fund holders described as fragile.
US rates and data
- US Bureau of Labor Statistics — Employment Situation, September 2026 (2 October 2026) — 29,000 jobs added; July and August revised lower. Next releases on 6 November and 4 December (schedule).
- Federal Reserve — minutes of the 15–16 September 2026 meeting (released 7 October 2026) — most participants saw another increase as likely appropriate by the end of the year.
- US Bureau of Labor Statistics — Consumer Price Index, September 2026 (14 October 2026) — prices up 3.7% over the year; gasoline up 9.1% in the month. Next releases on 10 November and 10 December (schedule).
- Kiplinger — September CPI report (14 October 2026) — the reading against economists’ expectations; gasoline’s share of the monthly rise.
- Fed Chair Kevin Warsh in Bangkok (AP via PBS NewsHour, 16 October 2026) — no signal on the next decisions; September’s increase the first in three years.
- Reuters poll of economists (via AOL, 20 October 2026) — 94 of 100 expect no change on 28 October; all 100 expect an increase in December.
- Federal Reserve — 2026 meeting calendar — meetings on 27–28 October and 8–9 December, the latter with economic projections.
- Trading Economics — Gold (23 October 2026) — the close of $3,993.96, the lowest since mid-July; CME FedWatch probabilities of about 10% for October and 80% for December.
- CNBC — US Treasury yields (23 October 2026) — the 10-year yield back near 5% during the week.
Price
- Reuters via Business Recorder (23 October 2026) — gold on track for its steepest weekly fall since June; oil at a five-month high; December increase expectations near 80%.
- Yahoo Finance — gold price, 23 October 2026 — oil at levels last seen in May.
- APMEX market note, 23 October 2026 — reported selling of gold to cover losses in technology shares.
- Reuters report via ad-hoc-news (3 October 2026) — gains after the jobs report faded on a firmer dollar and high bond yields.
- LBMA — Precious Metals Market Report: Q3 2026 (14 October 2026) — the quarter’s range and close for the LBMA Gold Price; gold held in London vaults.
Demand
- World Gold Council — gold ETF holdings and flows, September 2026 (7 October 2026) — record $31 billion of inflows in July–September; holdings at a record 4,256 tonnes; Europe’s share.
- World Gold Council — Gold Market Commentary, September 2026 (7 October 2026) — futures selling equivalent to 84 tonnes; continued fund buying as the price fell.
- World Gold Council — central bank gold statistics, August 2026 (6 October 2026) — net purchases of 39 tonnes.
- China’s central bank reserves, September 2026 (Reuters via Business Recorder, 7 October 2026) — the 23rd consecutive monthly addition.
Surveys
- LBMA/LPPM Global Precious Metals Conference 2026 — Sorrento, 4–6 October. The delegate survey’s figure of about $5,013 a year ahead: Kitco News (6 October 2026) and Newsquawk (6 October 2026).
- Reuters quarterly poll of analysts (via Kitco News, 29 July 2026) — 2027 average of $4,610.
Latest insights
- Good Delivery List Suspension: What Happens to Bars
- Hong Kong’s Gold Clearing and Title to Specific Gold Bars
- Gold Price Forecast 2026: Bank Targets
- Dollar–Treasury Correlation: Reading a Split Between the Short and Long End