
Gold Price Forecast 2026: Bank Targets
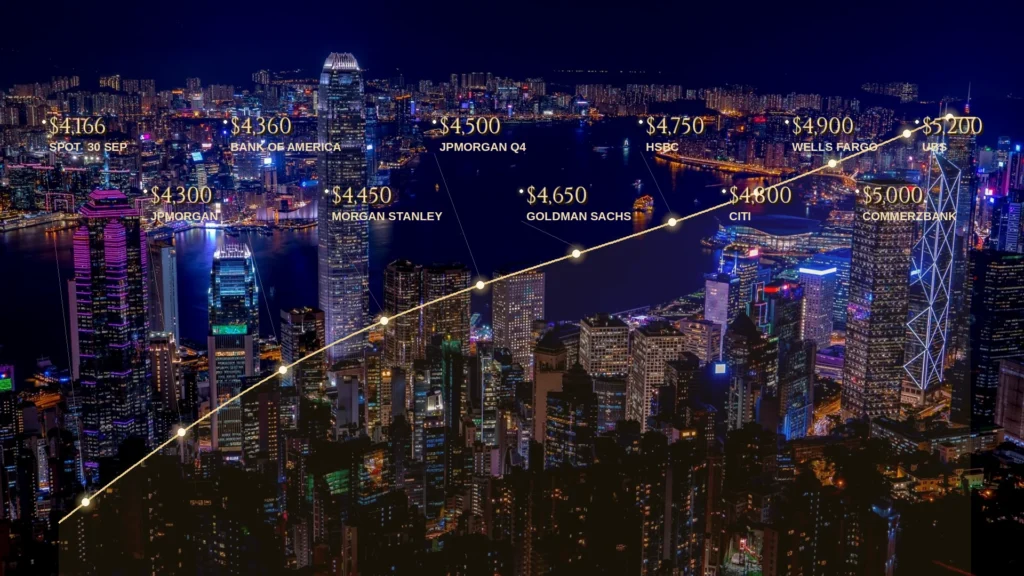
Between the September edition of this register and this one, the thing that finally moved was the rate, not the targets. On 16 September the Federal Reserve raised its range to 3.75–4.00% — unanimously, the first increase since 2023, with most officials projecting one more this year — and the first post-hike note landed within two days: Goldman Sachs trimmed its year-end level to $4,650 from $4,900 while leaving $5,400 for end-2027 untouched. Spot closed the quarter at $4,166.60 on 30 September, down 6.2% for the month — which puts every major published 2026 level above the market, from about 5% at Bank of America’s $4,360 average to more than 20% at the top of Wells Fargo’s range, the first time since the June edition that the whole register points one way from the prevailing price. And the field’s first resolution date lands on 30 September: JPMorgan’s $4,300 third-quarter average closes with the quarter it was written for. This page holds the post-hike state as of 30 September — each level dated to its note, each horizon named, each last move carried with its direction — while the September edition preserves the field as it stood going into the meeting.
Where the field stands in October
Spot gold closed the quarter at $4,166.60 on 30 September — down 6.2% for the month and 7.8% above a year earlier — and that is the level each row below is read against. Every figure here is an indicative reference price — delayed, rounded and aggregated from third-party market data; none is an executable quotation.
| Forecaster | Published level | Note date | Last move |
|---|---|---|---|
| JPMorgan | $4,300 Q3 average; $4,500 Q4 | 3 Jul | ↓; the Q3 row resolves with the 30 September close |
| Bank of America | $4,360 year 2026 average | 8 Jul | ↓ from $5,093 |
| Morgan Stanley | $4,450 Q4 2026 base case | 20 Aug | held; spot back below it since late September |
| Goldman Sachs | $4,650 year-end | 18 Sep | ↓ from $4,900, two days after the hike |
| HSBC | $4,750 year-end; $4,560 2026 average | 9 Jul | held through the hike |
| Citi | $4,800 on 0–3 months; $5,000 on 6–12 months | 24 Aug | ↑ near-term; the rolling window now reaches toward year-end |
| Wells Fargo Investment Institute | $4,900–5,100 year-end | week of 17 Aug | ↓ third cut of 2026 |
| Commerzbank | $5,000 year-end | poll-carried, undated | ↑ from $4,400 |
| State Street Global Advisors | $5,000 base case into early 2027 | July Monthly Gold Monitor | — |
| UBS | $5,200 on a 12-month view | May | ↓ from $5,500 |
Two publishers stay out of the register, as they did in September. Deutsche Bank’s levels still conflict across press reports. Standard Chartered’s chain has now gathered a third unreconcilable figure — a reported 21 September note carrying a $4,650 fourth-quarter average, a December hike view and $5,100 by mid-2027 — which again reaches the field only through secondary compilations, against different levels the bank itself published in December and April.
What the closing level does to the column is the quarter’s structural fact: every row stands above the market. The gaps run from about 5% at Bank of America’s average and 7% at Morgan Stanley’s base case, through just under 12% at Goldman’s revised year-end and 14% at HSBC’s marker, to more than 22% at the ceiling of Wells Fargo’s range — the first time since the June edition that the whole register points one way from the prevailing price. The horizon discipline set out in the September edition still governs the reading: averages and rolling windows do not measure against a print the way year-end markers do, so the gaps above are like-for-like only where the horizon is. Both consensus markers — the LBMA survey at $4,742 and the Reuters poll median near $4,916 — remain pre-revision artifacts, with the fourth-quarter collections their first scheduled replacement.
The September reset
By mid-September the repricing had a schedule. On 11 September the August CPI printed hot: headline up 0.4% after July’s 0.1%, gasoline up 3.9% and supplying over a third of the monthly increase, the twelve-month rate holding at 3.4%, core at 0.3% and the firmest since April. Hike pricing ran toward 90% on the release. Five days later the Federal Reserve moved the range up a quarter point to 3.75–4.00%, unanimous at 12–0, with the median end-2026 rate in the projections at 4.1%, up from 3.8% in June, and a majority of the written paths carrying a further increase before year-end. The previous hike dated to July 2023; this one opened only the fourth tightening cycle of the century. The chair described the move as removing a dose of accommodation and repeated that the committee “will deliver price stability”. Absorption took two sessions, with the decision priced near 90% by meeting day. The opening revision of the post-hike period followed on 18 September, when Goldman Sachs cut its year-end figure from $4,900 to $4,650, its economists now expecting another increase in October — and the same desk reiterated $5,400 for end-2027 within days.
Written into Goldman’s June cut note, one scenario clause met its event this month: an actual Fed hike could take gold toward $4,400 by year-end, the analysts had written — and the hike has now happened, with the 30 September close of $4,166.60 more than $230 under that level, so the summer’s most bearish published number now reads from the other side of the market. JPMorgan supplies the other resolution. Its $4,300 third-quarter average, the register’s only hard-dated entry, closes with the 30 September session and is measured on the quarter’s average from the quarter’s accounting rather than on any single close.
The post-hike round
Set against June and July, the striking feature of the post-hike round is how little of the field moved. The June–July wave produced four revisions in five weeks; the two weeks after the 16 September decision have produced one confirmed note — Goldman’s — and one reported move that cannot be admitted: Standard Chartered’s 21 September level remains locked out of the register by its own unreconcilable chain. Everything else held. HSBC’s markers at $4,750 and $5,025 have now stood untouched through a hot CPI, a Jackson Hole repricing and the first hike in three years, with spot still inside the $3,800–4,700 band the 9 July note drew around the year; JPMorgan’s $4,500 fourth-quarter level stands as its Q3 companion resolves; Wells Fargo has reported no fourth cut; Citi’s rolling pair was reconfirmed in early September and rolls on; Commerzbank, State Street and UBS carry their existing figures, UBS’s May note now the oldest live row in the column.
The one position the hike validated most is the one that spent July as the field’s outlier. Bank of America wrote a base case of three 2026 hikes alongside its July cut when the market priced barely one; the committee has now delivered the first and projects a second in most members’ written paths. The register’s most hawkish rate assumption is converging with the official path — which reads less as a forecast beaten and more as the reason its $4,360 average sits where it does: the level priced the tightening others were not carrying. A field that holds still while the rate moves is also a field with a scheduled reason to move next: the annual 2027 outlook notes concentrate in the fourth quarter, and each will replace a row here.
The rate path into 27–28 October
The next decision arrived on the calendar before the last one cooled. Pricing for a second hike ran up immediately after the September dot plot, then gave most of it back within two weeks: New York Fed President John Williams’ 29 September remark that there is “no need for urgency”, alongside softer labor readings, took October-hike odds to about 49% — with prediction markets putting “no change” near 60% — and the collapse ran inside a single day. Two prints stand between here and the decision: the September employment report on 2 October, where a strong print supports the second hike and a weak one supports a hold, and the September CPI on 14 October, the last inflation reading before the meeting. The committee’s own written guidance — one more increase this year, a 4.1% median end-2026 rate — does not name the meeting, and December remains the alternative slot. The register reads against that fork: most of its year-end levels were written on paths of zero to one hike, Bank of America’s on three, and the distance between those assumptions is still the widest thing in the column. The session-level mechanics — flows, policy and energy — are treated in the September market analysis.
Demand under the targets
Whether a level was cut or held, the floor assumption beneath it is the same, and the desk that revised most recently is the one quantifying it. Goldman Sachs expects central banks to buy an average of 50 tonnes of gold a month through 2026, up from 17 a month before 2022, and treats that bid as the reason a year-end level written with no rate cuts in it still lands at $4,650. The same research names a second support it deliberately leaves out of the number: demand for gold exposure through derivatives, part of what the bank calls the debasement trade, meaning allocation driven by rising sovereign debt and eroding confidence in fiat systems. Excluding it, the analysts write, raises the likelihood that the price exceeds the forecast, at the cost of greater two-sided volatility along the way.
Underneath the register the demand accounting is still the World Gold Council’s second quarter, the oldest data layer on this page. No quarterly demand accounting has spanned a rate hike since the 2023 tightening; the third-quarter edition, due in late October, will. Whether the official-sector bid held its pace through the move is the single number most of the register leans on, and the case for treating that bid as a reserve-asset foundation is set out in gold as a strategic reserve asset. Until then the ledger reads from the second quarter — total demand flat at 1,269 tonnes, ETFs down 45 tonnes in the quarter against a half-year still positive at 18, and 571 tonnes of over-the-counter absorption across the half.
The 2027 horizon
Through two cutting rounds, the 2027 levels have barely moved, and the desk that did the cutting demonstrates it best. Goldman Sachs took $500 off its 2026 level in June and another $250 in September, then reiterated $5,400 for end-2027 within days of the second cut. The cluster around that anchor holds its shape. HSBC’s $5,025 end-2027 marker has $5,200 and $5,300 behind it for 2028–2029. Commerzbank is at $5,200, Morgan Stanley’s August path runs above $5,000, Citi’s six-to-twelve-month $5,000 now reaches into the middle of next year, State Street’s base case crosses the year boundary, and Wells Fargo’s $5,400–5,600 tops the set. Measured against the 30 September close, the 2027 cluster runs 20% to 35% over the prevailing price — a wider unanimous gap than the 2026 set carries, published by desks that disagree by hundreds of dollars about December.
The September edition’s caveat travels with the cluster: a level eighteen months out has been tested by nothing, and where one publisher carries both years, the pair encodes the desk’s rate path as much as its view of gold. The desks that cut 2026 hardest have so far supplied exactly one dated 2027 replacement, Goldman’s reiterated $5,400.
Reading a dated forecast
To be usable, a level needs its four attachments — publisher, note date, horizon, and the direction of its last move — and this month tested the discipline twice. JPMorgan’s $4,300 third-quarter average expired on 30 September. The row now reads against the finished quarter’s accounting, and any document quoting it past that date is quoting a question whose answer has printed. Goldman’s June hike scenario resolved the other way: the hike arrived, and the market finished the month beneath the $4,400 the clause had named.
From here the page re-dates on a fixed calendar:
- 2 October — US employment report for September. Acts on the rate assumptions first; a strong print supports the second hike, a weak one the hold.
- 14 October — US CPI for September. The last inflation reading before the meeting.
- 27–28 October — FOMC. Resolves a second-hike pricing that has already round-tripped from above even to about 49%.
- Late October — World Gold Council, Q3 accounting. Tests the floor assumption the register leans on.
- Fourth quarter — LBMA and Reuters consensus collections. Replace benchmarks gathered before the June–July round.
None of the levels above is Golden Ark Reserve’s. This page reproduces third-party research as a dated record; the company publishes no price forecast, endorses none of these, and nothing here is investment advice or a recommendation on timing, suitability or allocation. Pricing on a defined lot is a separate object from any of it: a proposal on specific bars runs through physical gold purchase and is priced by executable quote at contract — a figure that binds on named serials at a stated moment, with no revision history and no horizon.
Sources
The September reset
- Federal Reserve — Chairman Warsh’s press conference transcript, 16 September 2026 — range raised to 3.75–4.00%; unanimous vote; median end-2026 rate of 4.1%; market pricing near 90% by decision day.
- FOMC decision coverage (Fox Business, 16 September 2026) — first increase since July 2023; “will deliver price stability”.
- Dot-plot and hike-count coverage (Yahoo Finance live, 16 September 2026) — most projections carrying at least one further 2026 increase; reported member counts vary across outlets and the count is therefore not stated precisely on this page.
- US Bureau of Labor Statistics — Consumer Price Index, August 2026 (11 September 2026) — +0.4% on the month after +0.1%; gasoline +3.9%, over a third of the monthly increase; 3.4% over the year.
- PNC Economics — August CPI note (11 September 2026) — core at 0.29%, the firmest since April; hike odds near 90% after the release.
- Goldman Sachs post-hike revision (Yahoo Finance, September 2026) — year-end 2026 to $4,650 from $4,900 on the 18 September note; $5,400 for end-2027 reiterated by analyst Lina Thomas; Goldman economists expecting a further increase in October.
- Post-hike field summary (London Gold Exchange, late September 2026) — the market absorbing the hike within two days; the reported Standard Chartered note of 21 September, carried here only in the omission note.
The rate path
- October pricing after Williams (30 September 2026) — “no need for urgency” remarks of 29 September; October-hike odds near 49%; prediction-market “no change” near 60%; the 2 October employment report and 27–28 October meeting dates.
- US inflation calendar — September CPI scheduled for 14 October 2026.
Price path
- Trading Economics — Gold (30 September 2026) — the quarter close at $4,166.60; −6.2% on the month; +7.8% over the year.
- Kitco — live gold (30 September 2026) — intraday session range.
Demand
- Goldman Sachs Research — central-bank demand and the derivatives layer (August 2026) — 50 tonnes a month expected from central banks in 2026 against 17 before 2022; derivatives-driven demand excluded from the target by construction.
- World Gold Council — Gold Demand Trends Q2 2026 (30 July 2026); the Q3 edition is scheduled for late October.
Register rows carried forward
- All rows dated 24 August or earlier — JPMorgan, Bank of America, Morgan Stanley, HSBC, Citi, Wells Fargo Investment Institute, Commerzbank, State Street, UBS — together with the Deutsche Bank and Standard Chartered omission notes and both consensus markers, carry forward from the September edition, where each is sourced to its primary or wire report.