Silver Price Forecast 2027: Bank and Analyst Targets
Silver price forecast 2027: what banks and analysts expect and why, the case for higher and lower prices, the assumptions that decide it, and the view to 2030.
In this article
- Where the forecasts meet and where they split
- The case for a gold-led recovery
- The case for a weaker market
- What decides between them
- Gold and the gold-to-silver ratio
- US interest rates and the dollar
- Investors and industry
- Solar panels, mines and recycling
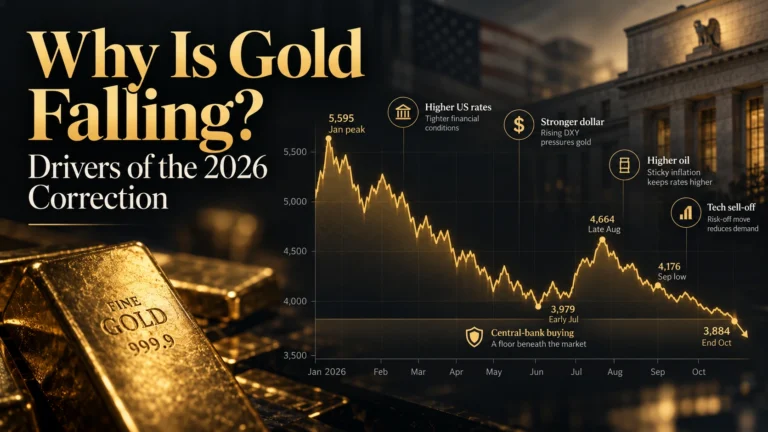
- How the forecasts moved during 2026
- How year-ahead forecasts have fared
- Further out: forecasts to 2030
- How to read a dated forecast
- Other metals
- Sources
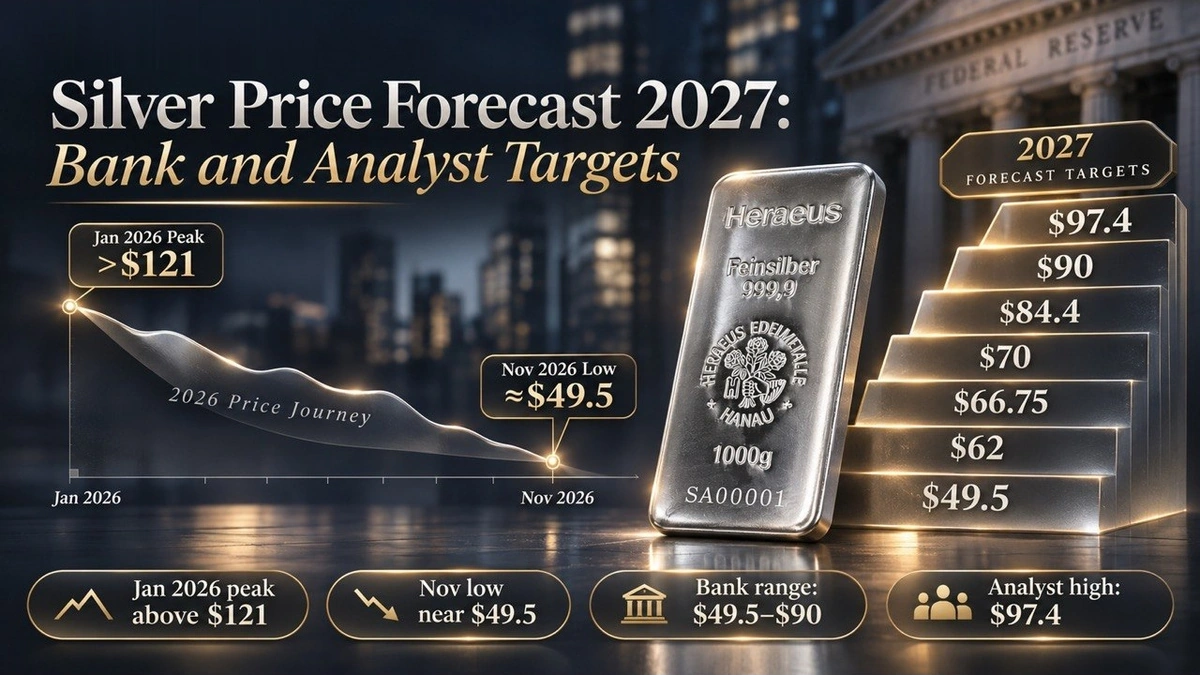
Banks and analysts expect silver to average well above its autumn low in 2027, with the middle of their range near $68 an ounce. Forecasters cut their numbers from the spring onwards as silver fell from a record above $121 in late January to $48.60 on 3 November. Even the lowest annual average sits more than a quarter above that low. Up to the middle of the year the forecasts mostly agree on firmer prices, and after that the paths part ways. One camp expects gold to lead silver higher as US interest rates ease and investors return to funds that hold the metal. The other expects more silver than buyers need, because solar-panel makers keep cutting the metal in each panel and more old silver is recycled.
Behind the gap between the lowest and highest forecasts lie two assumptions, the gold price and how many ounces of silver one ounce of gold will buy. At the early-November level of about 78 ounces, a gold price of $5,330, among the higher forecasts for the year, would put silver near $68. The higher silver forecasts need gold to rise and silver to rise faster still. Most of those forecasts also assume falling US interest rates, although the Federal Reserve, the US central bank, raised its rate in September. Year-ahead silver forecasts have missed by wide margins in both directions, so a forecast is best read with its date and the reasons behind it.
Where the forecasts meet and where they split
From lowest to highest, the table lists each forecast with the main reason its author gives. All prices on this page are indicative reference prices: delayed, rounded figures from third-party market data; none is a price at which silver can be bought or sold.
| Forecaster | Forecast for 2027 | What the figure covers | Published | Main reason given |
|---|---|---|---|---|
| Julius Baer (Swiss private bank) | $49.50 | Price in 12 months, around November 2027 | 3 November | Neutral rating; no reason reported |
| World Bank (international lender to developing countries) | $62 | Annual average | Commodity Markets Outlook, October | Steeper correction than gold after the gains of 2026 |
| JPMorgan (US bank) | $63.90 | Annual average | 13 August | Physical squeeze over; higher US rates; less silver in solar panels |
| HSBC (London-based bank) | $65 | Price at the end of 2027 | 14 May | Smaller shortfalls; more recycled and mined silver |
| Reuters poll (30 analysts and traders surveyed by the news agency) | $66.75 | Median forecast for the annual average | 27 October | US rates high for longer; weaker solar demand |
| HSBC | $68 | Annual average | 14 May | Weaker second half; wider gold-to-silver ratio |
| BMO Capital Markets (investment banking arm of Canada’s Bank of Montreal) | $69.30 | Average for January–March | 28 September | Silver trails gold; thrifting and slower solar building |
| Deutsche Bank (German bank) | $70 | Average for April–June | Early October | Surplus possible as soon as 2027 after a fast fall in demand |
| Bank of America (US bank) | $70 | Annual average ($75 for April–September) | 5 November, as reported in the press | Surplus in 2026; lower solar use |
| WisdomTree (fund manager that issues exchange-traded products on metals) | $70.55 | Model value for July–September | 22 October | Gold recovery; industrial weakness caps the gain |
| UBS (Swiss bank) | $75, $75, $80 | Price in March, June and September | 29 August, repeated 24–25 October | AI infrastructure demand; sixth year of shortage; silver tracks gold |
| Commerzbank (German bank) | $80 | Price at the end of 2027 | 28 July | Rise in gold; continuing shortage |
| Metals Focus (London research firm that produces the World Silver Survey) | $84.40 | Annual average; above $90 for October–December | 19 October, in an interview | Buying by funds that hold physical silver; gold at $5,330 |
| CIBC (Canadian bank) | $85 | Annual average | 19 October | Gold recovery to a $5,200 average |
| Citi (US bank) | $90 | Price 6–12 months after mid-August, between February and August 2027 | 13 August, repeated 15 September | Recovery in investor demand |
| LBMA conference delegates (LBMA: association of the London precious metals market) | $94.70–97.40 | Price at the next conference, October 2027 | 6 October | Poll of delegates; reports give different figures |
An average for the year counts every trading day from January to December, so weak months can offset strong ones. A price at the end of the year, or in a named month, describes a single point in time.
Among the seven annual averages, the middle figure is HSBC’s $68, about two-fifths above the 3 November low (Golden Ark calculation from source data). Five of the seven fall between $62 and $70. The other two, $84.40 and $85, stand well apart, and both depend on a recovery in gold.
Four of the five forecasters that also publish a 2026 average put the following year lower, by 5% to 11%. A lower average can still mean higher prices than in the autumn. Silver averaged $83.70 from January to March, by JPMorgan’s count, and the earlier averages carry those record months.
Where forecasters name a quarter or a month, the table shows the shape of each path through the year.
| Forecaster (2027) | January–March | April–June | July–September | October–December or end of year |
|---|---|---|---|---|
| JPMorgan, averages | $63 | $63.50 | $64 | $65 |
| BMO Capital Markets, average | $69.30 | — | — | — |
| Deutsche Bank, average | — | $70 | — | — |
| WisdomTree, model value | — | — | $70.55 | — |
| Bank of America, averages | $63 | $75 | $75 | $65 |
| UBS, prices in March, June and September | $75 | $75 | $80 | — |
| HSBC, price at the end of the year | — | — | — | $65 |
| Commerzbank, price at the end of the year | — | — | — | $80 |
| Metals Focus, average | — | — | — | Above $90 |
In Bank of America’s case, the January–March and October–December figures come from press reports of the bank’s August table.
Through the first half, the forecasts that name a quarter sit between $63 and $75, close together by silver’s standards. By the last quarter, the spread runs from $65 to above $90. HSBC sees the second half as the weaker one. Bank of America’s path climbs to a peak in the middle of the year and slips back by the end. Metals Focus has the highest point on any path, in the final quarter.
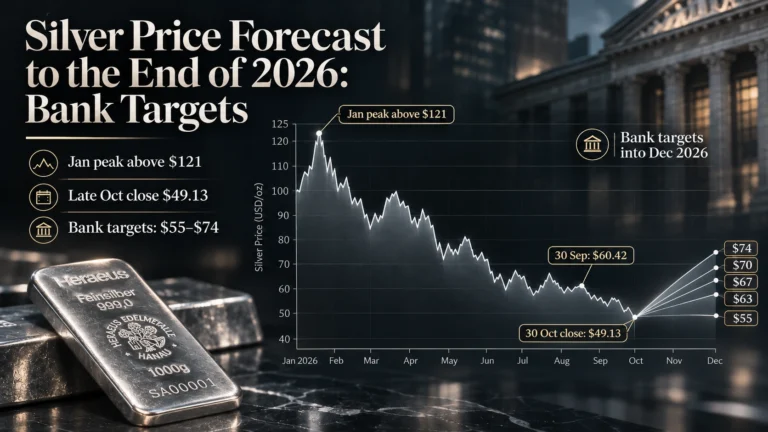
Nearer-term targets are in the silver price forecast to the end of 2026.
The case for a gold-led recovery
At the top of the range, the assumption is that gold recovers from its autumn fall and that silver, which usually moves further than gold when both rise or fall, rises faster. The gold-to-silver ratio, the number of silver ounces that one ounce of gold buys, would then fall. Silver’s close tracking of gold since the January record ties the two assumptions together.
Gold averaging $5,200 goes with CIBC’s $85 silver average, after a cut in its gold forecast from $6,500. The gold forecast draws on central banks, which bought 345 tonnes from January to June, and on record inflows into gold funds in July to September.
Although Metals Focus expects a theoretical surplus of 37.3 million ounces for the year, it forecasts an average price of $84.40. The forecast assumes buying by funds that hold physical silver, with gold averaging $5,330. Such buying has yet to arrive. Holdings in those funds have fallen by about 60 million ounces in 2026, the firm calculates. The late-October report had silver lagging gold for now and taking its lead from gold over the following 12 months.
Most of the weight in Commerzbank’s $80 forecast falls on gold. A continuing shortage helps too.
Since August, UBS has kept a path to $80 in September, with silver tracking gold. Demand from AI infrastructure and a sixth year of shortage lend support. At the 75 to 80 ratio that the bank looked for in April, $80 silver in September implies gold at $6,000 to $6,400 (Golden Ark calculation from source data).
Citi has a $90 target. The bank expects investor demand to recover and to matter more for the price than industrial use.
More cautiously, WisdomTree sees a recovery driven mainly by higher gold. Thinner silver use in solar panels and more recycling hold the rise back.
The highest figure on the page comes from a poll of delegates at the LBMA’s October conference. Participants judged structural demand healthy, even as high prices pushed industrial users to cut back where they could.
For silver to reach the upper end of the range, gold has to recover, US bond yields have to fall and money has to flow back into silver funds. Gold was falling in October as yields rose.
The case for a weaker market
London’s freely available silver stocks were 70% higher at the end of August than in October 2025, by Deutsche Bank’s count, while industry was using less of the metal. For the lower group, stocks on that scale mark the end of the shortage that lifted silver to its January record. A weaker market here still means annual averages of $62 to $68, above the price in the autumn. Such averages hold as long as industry keeps cutting the silver it uses and investors stay away from silver funds. Data-centre demand and Chinese buying are the two forces that forecasters name on the other side.
After a year in which silver outperformed gold, the World Bank expects silver’s annual average to fall 11.4%, against 7.6% for gold. The lender ties silver’s 14% fall in July to September to easing physical tightness and to higher interest rates weighing on investment. Growth in electronics and data centres offers some support, and the risks to the forecast look broadly balanced.
Prices barely move through the year in JPMorgan’s forecast. The physical squeeze has unwound, and higher US interest rates raise the cost of holding a metal that pays no interest. Thrifting in solar panels, the industry’s term for using less silver in each one, is a third reason. The forecast has the gold-to-silver ratio rising to around 75 over the year, with silver lagging gold in a rising market too.
In May, HSBC raised its forecasts but kept a cautious tone. The bank’s chief precious metals analyst, James Steel, warned that shrinking shortfalls “will not be sufficient to propel silver sharply higher”. A wider gold-to-silver ratio is part of the outlook. Silver could then ease even if gold rallies. More recycled and mined silver adds to supply in HSBC’s numbers.
Daniel Ghali, head of metals research at Deutsche Bank, sees demand falling so fast under high prices that the market could move into surplus within the year. Chinese demand for silver for solar panels is probably down by a third in 2026. Silver should trail gold.
As faster thrifting and slower solar building loosen the industrial market, BMO Capital Markets expects silver to do worse than gold over the coming quarters. Bank of America sits between the two groups, with averages that top out in the middle of the year. A surplus in 2026, with solar use down by up to 11%, was the bank’s October view.
Silver’s industrial side leaves it more exposed than gold when US rates stay high, according to the Reuters poll of 30 analysts and traders. One respondent, Rhona O’Connell of the US broker StoneX, thinks silver is likely to underperform gold while the solar industry is oversupplied.
In line with a neutral rating, Julius Baer set its 12-month target at $49.50, just below the price on the day of the note, $49.65.
What decides between them
Set side by side, the two groups of forecasts differ on four assumptions, each of which can be checked against data during the year.
Gold and the gold-to-silver ratio
Any silver forecast can be read as a gold forecast divided by a ratio. Gold at $5,000 and a ratio of 70 put silver at about $71.
Where a forecaster publishes both metals for the same period, the ratio behind its silver forecast can be worked out.
| Forecaster and period (2027) | Gold | Silver | Gold-to-silver ratio |
|---|---|---|---|
| LBMA conference delegates, October | $5,013.30 | $94.70–97.40 | 51.5–52.9 |
| CIBC, annual average | $5,200 | $85 | 61.2 |
| Metals Focus, annual average | $5,330 | $84.40 | 63.2 |
| WisdomTree, July–September | About $4,800 | $70.55 | About 68 |
| World Bank, annual average | $4,250 | $62 | 68.5 |
| Reuters poll, median annual average | $4,650 | $66.75 | 69.7 |
| JPMorgan, annual average | Not reported | $63.90 | About 75, the bank’s own forecast |
| Market, 6 November 2026 | $4,059.90 | $51.88 | 78.3 |
Golden Ark calculation from source data; the ratio is the gold price divided by the silver price.
In every pair in the table, silver regains some ground against gold compared with early November. The lower forecasts allow for a small step, to between about 68 and 75, while the higher ones need a ratio near 61 to 63, and the delegates’ poll implies about 52. From about 105 in April 2025, the ratio fell below 45 at silver’s January record and rose back to about 78 by early November. Over the modern era, the ratio has averaged roughly 55 to 70, in JPMorgan’s reckoning.
Three gold prices and three ratios give the grid of silver prices in the table.
| Gold price | Ratio 60 | Ratio 70 | Ratio 78, as in early November |
|---|---|---|---|
| $4,250, the World Bank’s annual average | $71 | $61 | $54 |
| $5,000 | $83 | $71 | $64 |
| $5,330, the Metals Focus annual average | $89 | $76 | $68 |
Golden Ark calculation from source data; each cell is the gold price divided by the ratio, rounded to the nearest dollar.
A narrower ratio can do more for silver than a higher gold price. Gold at $4,250 with a ratio of 60 gives $71, above the $68 that $5,330 gold gives at the early-November ratio. At that ratio, even the higher gold forecasts leave silver near the middle of the published range, so the upper silver forecasts depend on the ratio narrowing.
In JPMorgan’s analysis, a Federal Reserve that keeps raising or holding rates pushes the ratio up, because central banks buy gold on dips and silver has no such buyer.
US interest rates and the dollar
Silver pays no interest, so higher US rates make it more expensive to hold than cash or Treasury bills. Because silver is priced in dollars, a stronger dollar makes it dearer for buyers paying in other currencies.
On 16 September the Federal Reserve raised its rate by a quarter point to 3.75–4.00%, its first increase in three years, and kept it there on 28 October. After consumer prices for October rose faster than forecast, futures markets priced another increase on 9 December as all but certain.
In recent surprises in US data, silver moved further than gold. Consumer prices for September, 0.1 point above forecast, cut silver by 6.29% on 14 October, while gold lost a little over 1%. When bond yields fell and the dollar weakened after the US elections, silver rose about 5% on 4 November, against a little more than 3% for gold.
Against the path that markets priced in November, most forecasts assumed easier US rates.
| Forecaster | What the forecast assumes about US rates, yields and the dollar | Published |
|---|---|---|
| BMO Capital Markets | Quarter-point rate cuts in September and December 2027, in the forecast of the bank’s economists | 23 June |
| Citi | Lower bond yields and a weaker dollar from September to December 2026, with a less restrictive Federal Reserve | 13 August |
| JPMorgan | Rate increases dampen the appeal of precious metals | 13 August |
| CIBC | A fall in inflation-adjusted bond yields could start the recovery in gold | 19 October |
| WisdomTree | Bond yields and the dollar ease over the forecast period | 22 October |
| UBS | Rate expectations weigh in the near term; the longer path assumes that pressure passes | 24–25 October |
| Metals Focus | Higher rates and bond yields are the near-term risks | 29 October |
| Futures prices, as shown by CME FedWatch, a tool of the exchange operator CME Group | A rate increase on 9 December treated as close to settled | 10 November |
Forecasts from the summer looked for US rates to ease, and the Federal Reserve raised its rate in September. Later forecasts treat higher rates as the main near-term risk and look for relief further into the year. The Federal Reserve’s projections on 9 December will show how far its policymakers share that view.
Investors and industry
Industry takes more than half of the silver bought each year, and investor buying swings far more from one year to the next.
| Measure | Figure | Source |
|---|---|---|
| Industrial demand, 2025 | 657 million ounces, down 3% | World Silver Survey 2026, 15 April |
| Industrial demand, 2026 | About 640 million ounces | World Silver Survey 2026 (639.6 million); HSBC (642 million) |
| Industrial demand, 2027 | About 618 million ounces | HSBC, 14 May; Metals Focus, 19 October |
| Data centres | More than 10% of electrical and electronics demand in 2027 | World Silver Survey 2026 |
| Funds that hold physical silver | Holdings down about 60 million ounces in 2026 | Metals Focus, as reported on 5 November |
| Bars and coins | Up 18% in 2026 | World Silver Survey 2026 |
Measured in ounces, the metal that has left silver funds outweighs the whole surplus that Metals Focus forecasts, by more than half again (Golden Ark calculation from source data). Buying on that scale in the other direction would absorb the surplus, which is why the Metals Focus forecast rests on investors.
For two years running, industrial use has slipped, and a further fall is forecast. In WisdomTree’s account, the January price spike sped up efforts to use less silver or to replace it. Chinese solar makers’ work to cut silver use after the spike has lowered long-term expectations for silver per panel, in BMO’s view. Data centres are among the few growing uses, yet in 2025 savings in solar panels outweighed the gains from AI and data centres, according to the World Silver Survey.
Physical buying in Asia pulls both ways. India raised its import duty on gold and silver to 15% from 6% in May, and its silver imports have run about a quarter below a year earlier, in Deutsche Bank’s figures. Chinese imports were almost 50% higher in January to September than a year earlier, which Commerzbank reads as a sign that the autumn fall went too far. JPMorgan links strong Chinese buying in March to purchases brought forward ahead of a change in the tax treatment of solar exports.
Solar panels, mines and recycling
Of all industrial uses, solar panels take the most silver, and estimates of how fast that use is shrinking differ widely.
| Estimate | Fall in solar demand for silver in 2026 | Published |
|---|---|---|
| Bank of America | Up to 11% | October, as reported in the press |
| World Silver Survey (Silver Institute, the silver industry’s association, with Metals Focus) | 19%, to about 151 million ounces | 15 April |
| Deutsche Bank | More than 20% worldwide | Early October |
| JPMorgan | About 30%, roughly 60 million ounces | 13 August |
In the forecast of BloombergNEF, which researches energy markets, installations fall 10.8% in 2026, to 584 gigawatts, and recover to 618 gigawatts the year after. With installations up about 6%, solar use of silver falls whenever the silver in each panel drops by more than about 6%. At the 17% cut per cell that Deutsche Bank reports, solar use would fall by about 12% (Golden Ark calculation from source data). The Metals Focus view, that efficiency gains in panel making now outpace the growth in solar capacity, rests on the same arithmetic. Further out, Citi expects back-contact cells, a design that uses less silver, to become the standard by 2028.
Mine supply barely responds to the silver price. About 72% of mined silver comes as a by-product of copper, lead, zinc and gold, so output follows those metals. Mine output holds flat in 2026, at about 844 million ounces, in the World Silver Survey. HSBC puts output at 868 million ounces the year after, about 2% above its own estimate of 848 million for 2026. More silver should come from gold mines and less from copper mines, in WisdomTree’s outlook.
Recycling reacts faster to price. Recycled silver reaches 216 million ounces in 2026 in HSBC’s figures, up from 197 million in 2025.
More than 914 million ounces sat in London’s vaults at the end of August, more than 300 million of them free to buy, in Deutsche Bank’s count.
| Estimate | 2026 | 2027 | Published |
|---|---|---|---|
| World Silver Survey | Shortfall of 46.3 million ounces | Not covered | 15 April |
| Metals Focus, in an interview | Shortfall of 35.4 million ounces | Surplus of 37.3 million ounces | 19 October |
| HSBC | Shortfall of 5 million ounces | Shortfall of 12 million ounces | 26 October |
| Deutsche Bank | Not reported | Surplus possible | Early October |
| Bank of America | Surplus, no figure reported | Not reported | October, as reported in the press |
Since early 2025, revisions to these estimates have been larger than the surplus now expected. The shortfall for 2025 stood at 149 million ounces in the Silver Institute’s forecast of February 2025 and at 40.3 million ounces 14 months later, in the World Silver Survey. With errors of that size, the direction of the estimates says more than whether one year ends with a small surplus or a small shortfall.
How the forecasts moved during 2026
Since January, revisions to silver forecasts have followed the price, rising near the peak and falling with it from the spring. Many figures for the year were set or raised within weeks of the record.
CIBC published its $120 average within six days of silver’s record. No other forecast for the year has gone higher. UBS lowered its path at the end of April, after cutting its estimate of the 2026 shortage of silver from about 300 million ounces to 60–70 million. HSBC moved the other way in May, raising its average on persistent supply problems. JPMorgan cut its average by about a quarter in August, after the physical squeeze unwound. CIBC took about 29% off its average in October, together with a lower gold forecast.
| Forecaster | What the figure covers (2027) | Forecast by date of publication |
|---|---|---|
| CIBC | Annual average | $55 (20 October 2025) → $120 (4 February) → $85 (19 October) |
| JPMorgan | Annual average | $85 (11 February) → $85.80 (May) → $63.90 (13 August) |
| Commerzbank | Price at the end of the year | $95 (1 April) → $90 (4 June) → $80 (28 July) |
| Reuters poll | Median annual average | $71.80 (4 February) → $73.15 (April) → $66.75 (27 October) |
| UBS | Price in March | $85 → $75 (30 April), kept since |
| BMO Capital Markets | Average for January–March | $73.50 → $69.30 (28 September) |
| World Bank | Annual average | $37 (October 2025) → $65 (April) → $62 (October) |
| HSBC | Annual average | $57 (7 January) → $68 (14 May) |
| Bank of America | Average for April–June | About $75 (27 May), unchanged through November |
How year-ahead forecasts have fared
Forecasts for 2026 published in late 2025 turned out too low, and those published at the January peak too high.
| Forecast for 2026 | Made | What happened |
|---|---|---|
| World Bank: $41 average | October 2025 | The World Bank’s own estimate for the year, in October 2026, is $70 |
| Reuters poll: $50 average | October 2025 | The October 2026 poll put the average for the year at $70.30 |
| Macquarie (Australian bank): $33–34 average for January–March 2026 | 14 July 2025 | Silver averaged $83.70 in that quarter, in JPMorgan’s figures |
| Heraeus (German precious metals group): $43–62 range | 8 December 2025 | Silver’s record of $121.64 in January was about twice the top of the range; in November silver traded inside it |
| LBMA annual survey of analysts: $79.57 average | January 2026 | Above the estimates of about $70 for the year published in October 2026 |
| LBMA conference delegates: $59.10 a year ahead | October 2025 | Silver traded at $61.23 during the October 2026 conference |
In a market that more than doubled in three months and then lost more than half its value, the misses ran to tens of dollars an ounce. The closest call came from LBMA conference delegates, whose $59.10 was about $2 below the price at the time of the next conference.
Further out: forecasts to 2030
Beyond the first year, silver forecasts thin out, most of them pointing lower. HSBC’s averages step down every year, a decline the bank puts down to stocks above ground and recycled silver weighing on the price over time. No bank forecast for silver reaches past HSBC’s $52 for 2029. Gold forecasts run further.
| Forecaster | Silver | Gold | What the figures cover | Published |
|---|---|---|---|---|
| World Bank | $58 | $4,000 | Averages for 2028 | Commodity Markets Outlook, October |
| HSBC | $59 and $52, up from $49 and $47 | Not reported | Averages for 2028 and 2029 | 14 May |
| BMO Capital Markets | $47, up from $36 | $4,000, up from $3,100 | Long-term price | 28 September |
| CIBC | Not reported | $5,500, $4,800 and $4,500 | Gold averages for 2028, 2029 and 2030 | 19 October |
BMO’s long-term price is the kind of number analysts use to value mining projects, and says little about any particular year. CIBC’s gold path peaks in 2028 and eases to $4,500 by 2030, and reports of that forecast give no silver figures for those years. At BMO’s long-term prices, an ounce of gold buys about 85 ounces of silver, more than in early November (Golden Ark calculation from source data).
How to read a dated forecast
A forecast belongs to the date it was made, the period it covers and the reasons behind it. Forecasters usually revise their silver figures after the following reports and decisions.
| When | What | Why it matters |
|---|---|---|
| Mid-November 2026 | Interim review by the Silver Institute and Metals Focus (12 November in 2024, 13 November in 2025) | New estimate of the 2026 balance, and possibly a first official view of 2027 |
| November 2026 | Heraeus Precious Metals Forecast 2027 | Heraeus’s price range for the year |
| 9 December 2026 | Federal Reserve rate decision and policymakers’ projections | The path of US rates that the forecasts assume |
| January 2027 | LBMA annual forecast survey; Reuters poll around the end of the month | New annual averages from dozens of analysts |
| February 2027 | Silver Institute preliminary outlook (10 February in 2026) | First full balance for the year |
| April 2027 | World Silver Survey (15 April in 2026) and World Bank Commodity Markets Outlook (28 April in 2026) | Final figures for 2026 and revised forecasts |
| October 2027 | LBMA conference in Vienna | Test of the delegates’ forecast made in October 2026 |
None of the forecasts on this page is Golden Ark Reserve’s own. The page records what other institutions have published, with dates and sources; Golden Ark Reserve publishes no price forecast, does not endorse any of these figures, and nothing here is investment advice or a recommendation on when to buy or sell. Silver bars are listed with indicative prices in the silver bars catalogue. After payment, the price is fixed, including the premium.
Other metals
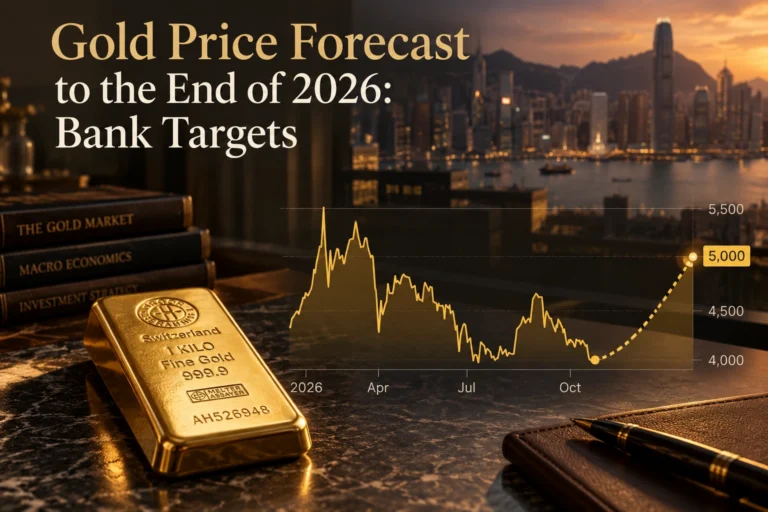
For gold, where most of these silver forecasts begin, bank targets are set out the same way in the gold price forecast to the end of 2026.
Sources
Prices and market moves
- Silver’s record of $121.64 on 29 January: Mining.com, carrying Reuters (4 February 2026)
- Silver’s low on 3 November: Canadian Mining Report (6 November 2026)
- Gold and silver on 6 November, CNBC figures: Canadian Mining Report (7 November 2026)
- Silver on 14 October: BeInCrypto (14 October 2026), Khaleej Times (14 October 2026)
- Gold and silver on 4 November: Kitco News (4 November 2026)
- Gold-to-silver ratio in April 2025: ETF.com (3 December 2025)
US interest rates
- Federal Reserve decisions of 16 September and 28 October: Equiti (October 2026), Admiral Markets (28 October 2026)
- October consumer prices and the 9 December meeting: Kitco News (10 November 2026)
Bank forecasts
- Bank of America: ExchangeRates.org.uk (7 November 2026), Canadian Mining Report (1 November 2026), ad-hoc-news (20 October 2026), Hisse.net (27 August 2026), Kitco News (27 May 2026)
- BMO Capital Markets: Kitco News (28 September 2026), Kitco News (23 June 2026)
- CIBC: investingLive (October 2026), Kitco News (20 October 2026), Kitco News (5 February 2026), TipRanks, from TheFly (October 2025)
- Citi: SMM (14 August 2026), Nasdaq (15 September 2026)
- Commerzbank: GOLDINVEST (1 April 2026), Kitco News (4 June 2026), FXStreet (28 July 2026), FXStreet (3 November 2026)
- Deutsche Bank: Kitco News (2 October 2026), IMA, on the bank’s report (October 2026)
- HSBC: Stockopedia, carrying Reuters (14 May 2026), SMM (18 May 2026), Newsquawk (7 January 2026), The Hans India, via IANS (26 October 2026)
- JPMorgan: J.P. Morgan Global Research (13 August 2026), Kitco News (11 February 2026)
- Julius Baer: Börse Express (3 November 2026)
- UBS: Investing.com (30 April 2026), Yahoo Finance (April 2026), Canadian Mining Report (29 September 2026), Canadian Mining Report (26 October 2026), Canadian Mining Report (October 2026), Börse Express (29 October 2026)
Polls, surveys and research
- World Bank: Kitco News (5 November 2026), Commodity Markets Outlook forecasts (April 2026), Kitco News (30 October 2025)
- Reuters polls: KFGO, carrying Reuters (27 October 2026), WTVB, carrying Reuters (27 October 2026), WMBD, carrying Reuters (27 October 2026), roic.ai (27 October 2026), Kitco News, carrying Reuters (29 July 2026), Crypto Briefing (April 2026), roic.ai (4 February 2026), Kitco News, carrying Reuters (27 October 2025)
- Metals Focus: Kitco News (19 October 2026), SMM, carrying GOLDINVEST (23 October 2026), FXStreet (5 November 2026)
- WisdomTree: WisdomTree (22 October 2026)
- LBMA conference delegates: Kitco News (6 October 2026), Metal Radar (October 2026), Kitco News (28 October 2025)
- LBMA annual forecast survey: LBMA (January 2026)
- Heraeus: Precious Metals Forecast 2026 (8 December 2025), Precious Forecast page (next edition due in November 2026)
- Macquarie: Kitco News (14 July 2025)
- World Silver Survey 2026, Silver Institute and Metals Focus: Mining.com, carrying Reuters (15 April 2026); industrial demand and bars and coins: Crux Investor (2026); solar panels and data centres: Crux Investor (2026); mine output: Crux Investor (2026)
- Silver Institute forecast for 2025, published in February 2025: CoinWorld (February 2025)
- BloombergNEF on solar installations: TaiyangNews (16 October 2026)
Calendar
- Interim reviews by the Silver Institute and Metals Focus: 2025 (13 November 2025), 2024 (12 November 2024)
- Silver Institute preliminary outlook: Silver Institute (10 February 2026)
Latest insights
- Silver Price Forecast to the End of 2026: Bank Targets
- Why Is Gold Falling? Drivers of the 2026 Correction
- Gold Price Forecast to the End of 2026: Bank Targets
- Good Delivery List Suspension: What Happens to Bars