Silver Price Forecast to the End of 2026: Bank Targets
Silver price forecast to the end of 2026: where major banks see silver at year-end, how their figures changed this year, and the dates still ahead.
In this article
- Where bank forecasts stand for the end of 2026
- What whole-year averages say about December
- What pushed silver below $50
- How silver moved around the US elections on 3 November
- How the forecasts changed during 2026
- Supply and demand in 2026: deficit or surplus
- What could lift silver by the end of 2026, and what could hold it back
- How to read a dated forecast
- Other metals
- Sources
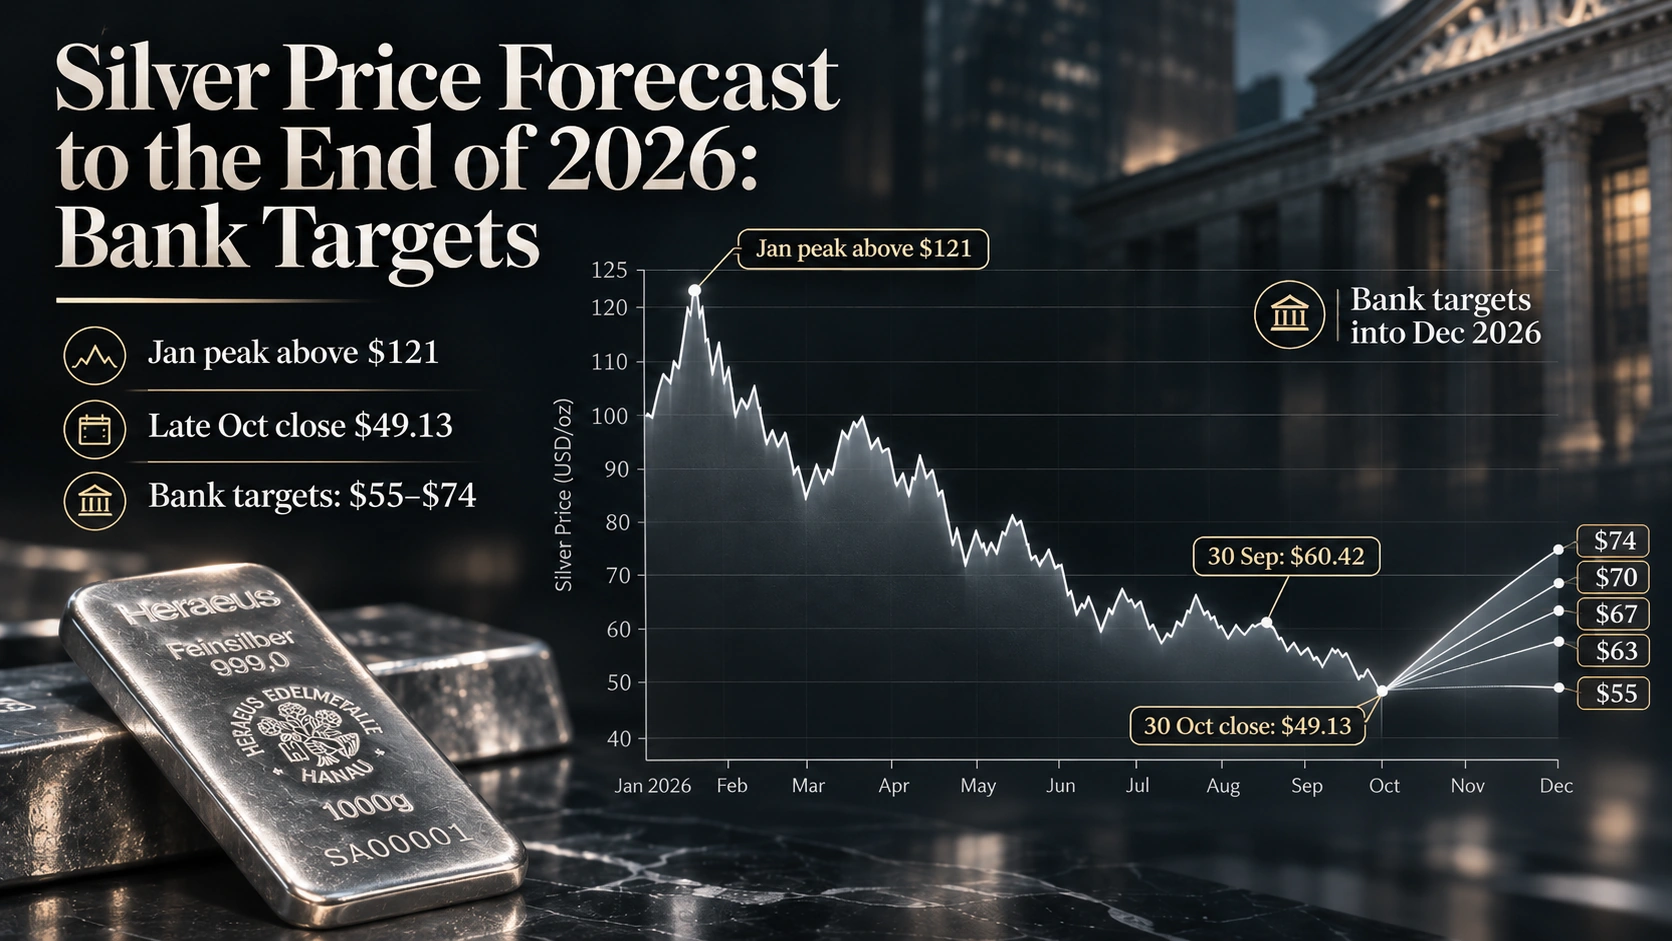
Silver reached a record above $121 an ounce in late January 2026 and later fell to less than half that level. Banks lowered their year-end forecasts several times on the way down, yet even the lowest of them sits above the $48.60 that silver touched on 3 November, its weakest price in 12 months. Several forecasts were published months before the October fall and the US elections in November, and they cover different things, from a price on one day to a three-month average. Because silver pays no interest, it tends to lose appeal when the Federal Reserve, the US central bank, raises interest rates.
Where bank forecasts stand for the end of 2026
From lowest to highest, the table lists each bank’s latest forecast beside $48.60, silver’s low on election day. All prices on this page are indicative reference prices: delayed, rounded figures from third-party market data; none is a price at which silver can be bought or sold.
| Forecaster | Forecast | What the figure covers | Published | Change from the previous forecast |
|---|---|---|---|---|
| Bank of America (US bank) | $55 | Last three months of 2026 | 20 October, as reported in the press | New quarterly figure; in May the bank put its average for the whole of 2026 at $85.93 |
| JPMorgan (US bank) | $63 | Average for the last three months of 2026 | 13 August | Down from $90 in May |
| Commerzbank (German bank) | $67 | Price at the end of 2026 | 28 July | Down from $80 in early June |
| BMO Capital Markets (investment banking arm of Canada’s Bank of Montreal) | $67.40 | Average for the last three months of 2026 | 28 September | Down from $71.40 |
| HSBC (London-based bank) | $70 | Price at the end of 2026 | 18 May | HSBC’s silver report of 26 October gave no new price forecasts |
| UBS (Swiss bank) | $70 | Price in December 2026 | 29 August, repeated in September | Down from $80 at the end of April |
| ING (Dutch bank) | $74 | Average for the last three months of 2026 | 24 June | Down from $84 |
Where a bank names a date, such as the end of the year or December, the forecast is the price on that day. An average for the last three months of the year works differently, because the weeks already behind it count toward the result.
Five months separate the oldest forecast in the table from the newest. HSBC’s dates from May. Bank of America’s came on 20 October, ten days before silver fell below $50.
Outside the table, a scenario and two three-month targets still circulate. The gold-to-silver ratio shows how many ounces of silver one ounce of gold buys. A return of the ratio to its past lows would put silver between $135 and $309, in a January scenario from Bank of America. Citi, the US bank, gave targets of $150 on 27 January and $75 in mid-August, each for the following three months only.
What whole-year averages say about December
Some forecasters publish only an average for the whole of 2026. The later such an average is published, the more of the year it already contains: silver averaged $83.70 in January to March alone, according to JPMorgan. A whole-year average therefore says more about the months behind it than about December.
| Forecaster | Average for 2026 | Published | Change from the previous forecast |
|---|---|---|---|
| World Bank (international lender to developing countries) | $70 | Commodity Markets Outlook, October | Not reported |
| Reuters poll (30 analysts and traders surveyed by the news agency) | $70.30 | 27 October | Down from $72 in July |
| JPMorgan | $70.60 | 13 August | Down from $84.30 in May |
| Metals Focus (London research firm that produces the silver industry’s annual World Silver Survey) | $72.60 | 19 October, in an interview | Not reported |
| HSBC | $75 | 18 May | Up from $68.25 |
What pushed silver below $50
Silver lost close to a fifth of its value in October, nearly three times as much as gold. On 14 October alone it fell more than 6%, after US consumer prices for September rose faster than expected.
| Date | What happened | Silver |
|---|---|---|
| 30 September | Last close of September | $60.42 at the close |
| 1 October | US inflation data came in below expectations, and the chance of a rate increase in October fell | Back above $61 |
| 14 October | US consumer prices were 3.7% higher than a year earlier, against a forecast of 3.6%; markets put the chance of a rate increase in December at 93% | Down 6.29% to $55.74, the lowest close of the year at that point |
| 29 October | The PCE price index, the inflation measure the Federal Reserve prefers, was 3.6% higher than a year earlier | $52.58, the lowest since November 2025 |
| 30 October | Selling continued on the last trading day of the month | $49.13 at the close, the lowest in 11 months |
On 28 October the Federal Reserve held its rate at 3.75–4.00%, the level set in September by its first increase in three years. Two of the 12 policymakers who vote on the rate wanted a further increase. Markets were betting on one at the next meeting, on 9 December.
A stronger dollar added to the pressure. Silver is priced in dollars, so it becomes more expensive for buyers paying in other currencies when the dollar rises. On 14 October the dollar index, which measures the US currency against six others, rose above 102.
Silver usually moves further than gold in both directions. Industry uses more than half of the silver bought each year, so its price also follows the outlook for manufacturing.
How silver moved around the US elections on 3 November
When Americans voted in the midterm elections on 3 November, they chose a new House of Representatives and about a third of the Senate, the two chambers of Congress. Polls had pointed to a new majority in the House, with the Senate too close to call. Gold fell 11% in the eight weeks before the vote, the steepest drop ahead of any of the five midterms compared by BullionVault, an online marketplace for gold and silver. Investors adjusted their positions ahead of the result, lifting silver to $51.25 on 2 November, in BullionVault’s account. Silver then touched about $48.60 on election day, its lowest in 12 months.
By Reuters’ count, the Democrats won majorities in both chambers. Two Senate races were still undeclared on 6 November, and the new Congress takes its seats on 3 January 2027. Markets read the result as a divided government, with the White House and Congress held by different parties. Investors expected more deadlock and more restrained federal spending, which could reduce how much the government needs to borrow.
| Measure | After the vote |
|---|---|
| Dollar index | Fell to about 101.2 by 5 November |
| Yield on 10-year US government bonds | About 4.93% in early trading on 4 November, down from about 4.95% |
| Brent crude, the international oil benchmark | Down about 9% on 4 November, the largest daily fall since April |
| Gold | Up more than 3% on 4 November, and about 2% more by midday in Asia on 5 November |
| Silver | Up about 5% on 4 November, then $53.11 by midday in Asia on 5 November |
Silver gained more than gold on 4 November, helped by lower bond yields and a weaker dollar, and ended the week of the vote 5.6% higher.
Interest-rate expectations barely moved. Futures put the chance of a December rate increase at 77.4% before the vote and 80.7% after it, in figures from CME FedWatch, a tool of the exchange operator CME Group. A jobs report on 6 November showed 165,000 new jobs in October and unemployment at 4.1%. Consumer prices for October, published on 10 November, rose faster than forecast. Markets then treated a December increase as close to settled, and silver fell about 3%, to around $51.70.
In the view of Metals Focus, the results add “a new layer of unpredictability” for precious metals. On that reading, deadlock in Congress makes more government stimulus less likely, while cuts to the budget deficit large enough to matter remain unlikely. Metals Focus sees the outcome as a mild plus for gold and silver, although for silver easier financial conditions have to be weighed against softer demand from industry.
Before the year is out, the outgoing Congress has one more deadline to meet. Government funding runs out on 11 December, and an extension is needed to avoid a partial shutdown.
How the forecasts changed during 2026
Most banks raised their silver forecasts early in the year, around the January record, and have cut them in steps since the spring.
| Forecaster | What the figure covers | Forecast by date of publication |
|---|---|---|
| Commerzbank | Price at the end of 2026 | $95 (13 January) → $90 (27 March) → $80 (4 June) → $67 (28 July) |
| JPMorgan | Average for the last three months of 2026 | $85 (February) → $90 (May) → $63 (13 August) |
| UBS | Price in December 2026 | $85 → $80 (30 April) → $70 (29 August) |
| ING | Average for the last three months of 2026 | $84 → $74 (24 June) |
| BMO Capital Markets | Average for the last three months of 2026 | $71.40 → $67.40 (28 September) |
| Reuters poll | Average for 2026 | $50 (October 2025) → $79.50 (February) → $78 (April) → $72 (July) → $70.30 (October) |
As US interest rates rose, investors pulled back, and the cuts followed. Rising bond yields and a stronger dollar were ING’s reasons when it lowered its forecasts in June. For JPMorgan, the trouble was investor buying, which faded after the fall from the January record.
On the industrial side, demand has softened as well. Commerzbank made its first cut in March, citing economic uncertainty from higher energy prices. The bank’s June cut followed a forecast from the Silver Institute, the silver industry’s association, of a second year of falling industrial demand. In ING’s reading, solar-panel makers keep reducing the silver in each panel.
UBS cut its price targets in April after sharply lowering its estimate of the shortage of silver. Bank of America, in its October note, expected supply to exceed demand in 2026 and put the possible drop in solar use at 11%.
By mid-November, none of the banks in the table had published a new silver forecast since the US elections.
Supply and demand in 2026: deficit or surplus
A deficit means that the world uses more silver in a year than mines and recycling supply, and the gap is met from stocks. In the Silver Institute’s annual survey, produced by Metals Focus, 2026 is set to be the sixth deficit year in a row. Bank estimates range from a larger shortfall to a surplus.
| Forecaster | Estimate for 2026 | Published |
|---|---|---|
| UBS | Shortfall of 60–70 million ounces, down from about 300 million | 30 April |
| Silver Institute and Metals Focus, World Silver Survey | Shortfall of 46.3 million ounces, up from 40.3 million in 2025 | 15 April |
| Metals Focus, in an interview | Shortfall of 35.4 million ounces | 19 October |
| HSBC | Shortfall of 5 million ounces | 26 October |
| Bank of America | More silver than the market needs; no figure reported | 20 October, as reported in the press |
About 19% less silver is going into solar panels in 2026, the sharpest yearly drop on record for that use. Panel makers are thinning the silver in each panel, and the survey’s figure for their total use is around 151 million ounces. Installations are slowing too. BloombergNEF, which researches energy markets, sees global solar installations falling in 2026 for the first time in about two decades. Chinese solar demand for silver is down about a third this year in an October estimate from Deutsche Bank, the German bank.
Demand for bars and coins moves the other way. Buying of both should rise 18% in 2026, the survey shows.
To cover the gap, the market has drawn 762 million ounces from stocks since 2021, by the survey’s count. London’s free stocks, meanwhile, are back at their highest since November 2024, in the same Deutsche Bank note. Silver held above ground and recycled metal could in time cap big price gains, in HSBC’s view.
Whether the official 2026 deficit changes will become clear in mid-November, when the Silver Institute and Metals Focus publish their interim review.
What could lift silver by the end of 2026, and what could hold it back
Forecasters name several things that could lift silver before the end of the year, and several that could hold it back.
| Argument | Direction | Who makes it | When |
|---|---|---|---|
| Every bank forecast for the end of 2026 is above the 12-month low silver touched on 3 November | Up | Seven banks | May–October |
| The autumn fall went too far: China imported almost 50% more silver in January–September than a year earlier | Up | Commerzbank | 3 November |
| The market is heading for a sixth year in a row of shortage | Up | Silver Institute and Metals Focus | April; interim review due in mid-November |
| Investor demand is recovering | Up | HSBC | 26 October |
| The election result is modestly positive for gold and silver, though weaker industrial demand weighs on silver | Up | Metals Focus | 5 November |
| Markets treat a US rate increase in December as almost certain after inflation data on 10 November | Down | Futures prices, as shown by CME FedWatch | 10 November |
| Stocks above ground and recycled silver may limit large rallies; the shortage in 2026 shrinks to 5 million ounces | Down | HSBC | 26 October |
| The market will have more silver than it needs in 2026, and solar use could fall 11% | Down | Bank of America | 20 October, as reported in the press |
| Solar panels will use about 19% less silver in 2026 | Down | Silver Institute and Metals Focus | April |
| Silver is rated neutral | Neutral | Julius Baer (Swiss private bank) | 3 November |
How to read a dated forecast
A forecast belongs to the date it was made and the period it covers. Three earlier forecasts can now be set against the price: one has reached its date, and two cover the whole of 2026. Two of them come from the LBMA, the association of the London precious metals market.
| Forecast | Made | What happened |
|---|---|---|
| LBMA conference delegates: $59.10 a year ahead | October 2025 | Silver traded at $61.23 during the 2026 conference |
| LBMA annual survey of 26 analysts: $79.57 average for 2026, with individual averages from $44.25 to $125 | January 2026 | The year is not over; the latest Reuters poll puts the 2026 average at $70.30 |
| Heraeus (German precious metals group): $43–62 range for 2026 | 8 December 2025 | Silver’s high of more than $121 in January was above the range; after the autumn fall, silver traded inside it |
These dates can move silver, and the forecasts, before the end of the year:
- US inflation: producer prices for October on 13 November, consumer prices for November on 10 December, producer prices for November on 15 December.
- US jobs: the report for November on 4 December.
- Federal Reserve: the rate decision on 9 December, with policymakers’ updated economic projections.
- US government funding: runs out on 11 December unless Congress extends it.
- Silver market reports: the interim review by the Silver Institute and Metals Focus in mid-November, and the Heraeus Precious Metals Forecast 2027 in November.
- January 2027: the LBMA’s annual forecast survey, with the next Reuters poll around the end of the month.
None of the forecasts on this page is Golden Ark Reserve’s own. The page records what other institutions have published, with dates and sources; Golden Ark Reserve publishes no price forecast, does not endorse any of these figures, and nothing here is investment advice or a recommendation on when to buy or sell. Silver bars are listed with indicative prices in the silver bars catalogue. After payment, the price is fixed, including the premium.
Other metals
Bank forecasts for gold at the end of 2026 are set out the same way in the gold price forecast to the end of 2026.
Sources
Prices and market moves
- Silver’s close on 30 October, its price on 2 November and gold before the vote: BullionVault (2 November 2026)
- Silver and gold in October; silver’s larger moves: GoldSilver (30 October 2026)
- US inflation data and silver: Trading Economics (1 October 2026), BeInCrypto (14 October 2026), Khaleej Times (14 October 2026), Trading Economics (29 October 2026)
- The dollar index on 14 October: CMC Markets (14 October 2026)
- Federal Reserve decisions of 16 September and 28 October: Equiti (October 2026), Admiral Markets (28 October 2026)
- Industrial share of silver demand: Invezz, on ING research (14 December 2025)
US elections
- Markets on 4 November: Kitco News (4 November 2026), XTB (4 November 2026)
- Results as reported by Reuters, and CNBC’s figures for gold and silver: Canadian Mining Report (6 November 2026)
- Gold and silver on 5 November: Bloomberg, via Energy Connects (5 November 2026)
- The dollar index and the odds of a December rate increase: Finimize, citing Reuters and CME FedWatch (5 November 2026)
- Silver over the week of the vote: Money Metals (9 November 2026)
- US jobs for October: StockWire (7 November 2026)
- US consumer prices for October: Kitco News (10 November 2026)
- Metals Focus on the result: Money Metals (5 November 2026)
- US government funding deadline: Holland & Knight (9 October 2026)
Bank forecasts
- Bank of America: ad-hoc-news (20 October 2026), Kitco News (1 May 2026), Kitco News (5 January 2026)
- JPMorgan: J.P. Morgan Global Research (13 August 2026), Kitco News (11 February 2026), FXStreet (30 July 2026)
- Commerzbank: Informist (13 January 2026), Informist (27 March 2026), Kitco News (4 June 2026), FXStreet (28 July 2026), FXStreet (3 November 2026)
- BMO Capital Markets: Kitco News (28 September 2026)
- HSBC: SMM (18 May 2026), The Hans India, via IANS (26 October 2026)
- UBS: Investing.com (30 April 2026), GoldSilver (August 2026), Equiti (October 2026)
- ING: Kitco News (24 June 2026), ING THINK (24 June 2026)
- Citi: Bloomberg (27 January 2026), SMM (13 August 2026)
- Deutsche Bank: Kitco News (2 October 2026)
- Julius Baer: Börse Express (3 November 2026)
Polls, surveys and research
- World Bank: Kitco News (5 November 2026)
- Reuters polls: KFGO, carrying Reuters (27 October 2026), Kitco News, carrying Reuters (29 July 2026), Kitco News, carrying Reuters (4 February 2026)
- Metals Focus: Kitco News (19 October 2026), FXEmpire (5 November 2026)
- World Silver Survey 2026, Silver Institute and Metals Focus: Mining.com, carrying Reuters (15 April 2026); solar demand: FXStreet (14 October 2026)
- BloombergNEF on solar installations: WisdomTree (22 October 2026)
- LBMA annual forecast survey: LBMA (January 2026)
- LBMA conference delegates: Kitco News (6 October 2026)
- Heraeus: Precious Metals Forecast 2026 (8 December 2025), Precious Metals Forecast 2027 (due in November 2026)
Calendar
- US data releases: US Bureau of Labor Statistics, November 2026, December 2026
- Federal Reserve meeting of 8–9 December: Kitco News (10 November 2026)
Latest insights
- Silver Price Forecast 2027: Bank and Analyst Targets
- Why Is Gold Falling? Drivers of the 2026 Correction
- Gold Price Forecast to the End of 2026: Bank Targets
- Good Delivery List Suspension: What Happens to Bars