When Will Gold Bottom? Support Levels and Signs of a Floor
Where analysts see gold's next support, what has marked a floor in past declines, and the US dates that could end the 2026 fall.
In this article
- Where gold stands now
- Where analysts see the next support
- Why $3,500 comes up so often
- What would show the fall has stopped
- Levels the price would need to regain
- The World Gold Council’s three conditions
- Oversold readings
- What could end the decline, and when
- How earlier declines found a floor
- Lows and rebounds in 2026
- Five pullbacks since 1974
- How to read a support level
- Sources
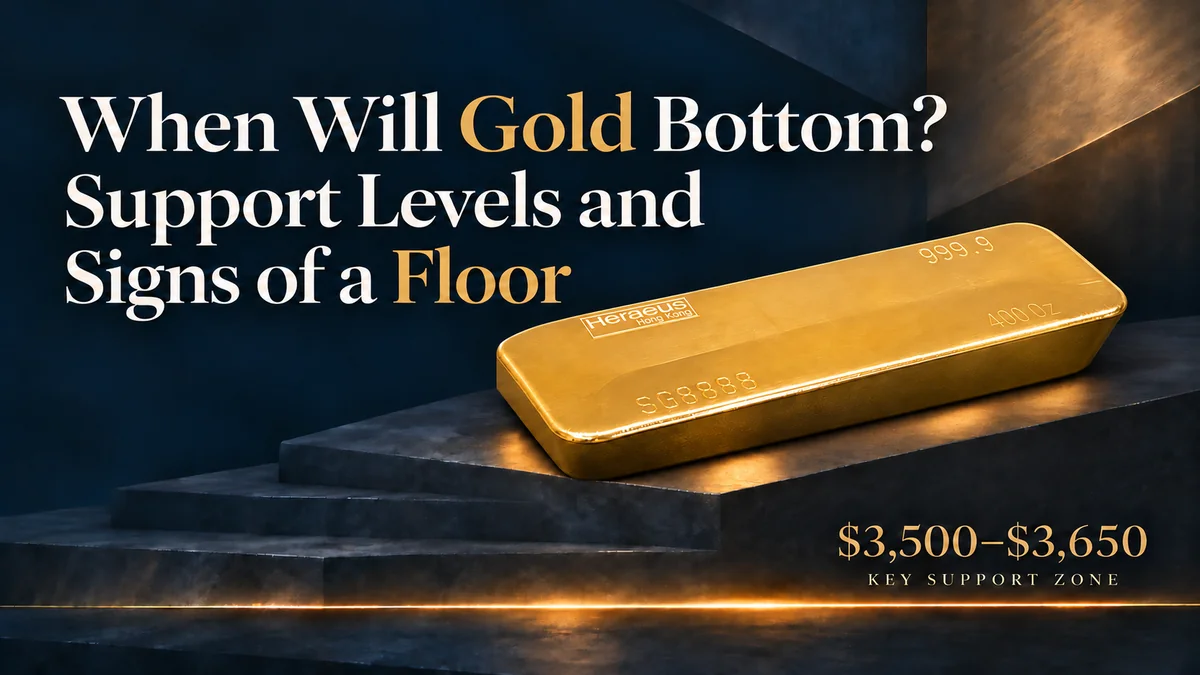
Anyone deciding when to buy gold is looking at a fall that has taken the price about a third below its January record. None of the analysts who published price levels in mid-November says the fall is over. Most of the support levels they named sit between $3,500, the record gold set in April 2025, and $3,650. Each low earlier in 2026 was followed by a rebound of 6.5% to 16.5%, and each rebound ended in a lower low. Several forecasters link a lasting turn to the end of US interest-rate increases, without naming a date for the low; the Federal Reserve, the US central bank, next decides on rates on 9 December.
Where gold stands now
The current price and all closing prices on this page are indicative reference prices: delayed, rounded figures from third-party market data; none is a price at which gold can be bought or sold. The price and the changes in the table update during trading hours.
Indicative price, not an offer. Updated 00:22 UTC
Change in the gold price
3,618.18 USD/oz
| Period | Change |
|---|---|
| Today | −0.21% |
| 1 Week | −6.86% |
| 30 Days | −12.63% |
| 6 Months | −19.87% |
| Year to date | −16.01% |
| 1 Year | −10.94% |
Updated 00:22 UTC
| Reference point | Date | Price |
|---|---|---|
| Previous record, reached during the day | 22 April 2025 | $3,500.05 |
| Close of 2025, the base for the change since the start of the year | 31 December 2025 | $4,307.95 |
| Record close | 29 January 2026 | $5,501.70 |
| Close against which the analysts’ levels are measured | 18 November 2026 | $3,725.77 |
The record of April 2025 is the high during the day reported by Reuters; the other three are closing prices.
The fall has been fast. BullionVault, a London-based online service for buying and storing gold, found that the benchmark price set each afternoon in London fell 15.1% in the 12 weeks to 13 November. That was the fifth-steepest 12-week fall of the past 20 years, and on 16 November Reuters reported gold on course for its worst year since 2015. The causes of the fall from the January record are set out in why gold has fallen in 2026.
Where analysts see the next support
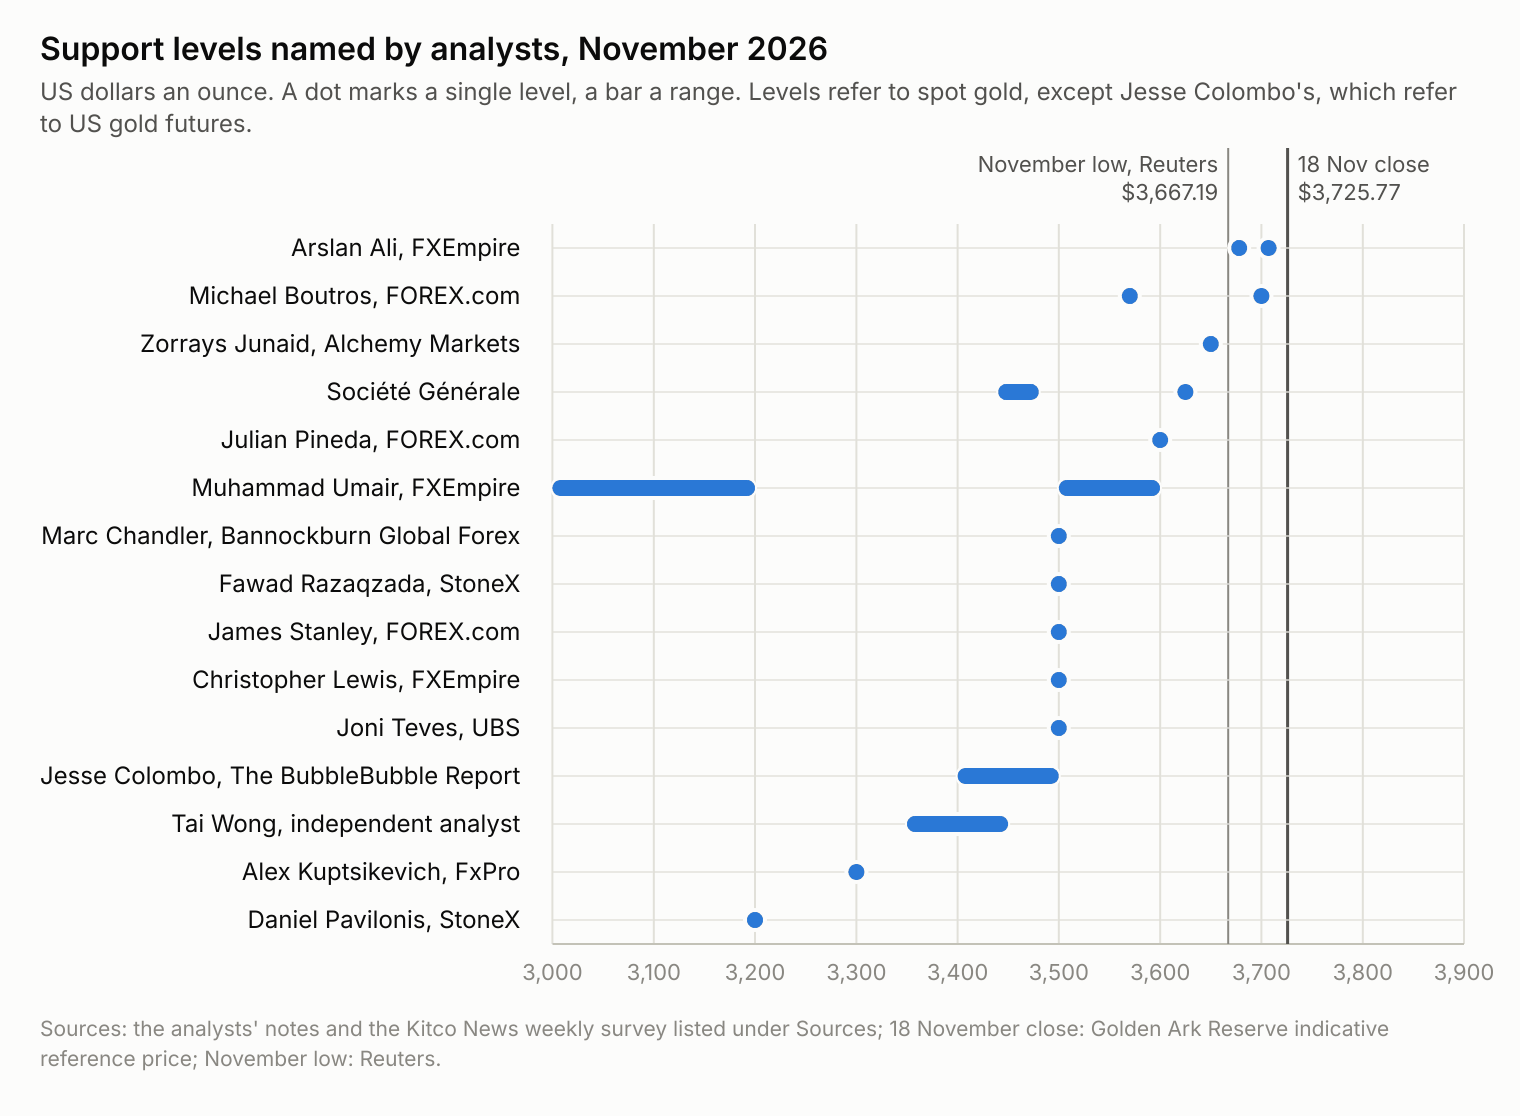
A support level is a price where, on an analyst’s reading of past prices, buyers have stepped in before and could slow a fall. Levels published in November run from just under the 18 November close to almost 20% below it.
| Analyst | Firm | Published | Level | What they expect there | Below the 18 November close |
|---|---|---|---|---|---|
| Arslan Ali | FXEmpire, a financial markets news and analysis site | November | $3,707, then $3,678 | A drop below $3,707 opens the way to $3,678 | 0.5%; 1.3% |
| Michael Boutros | FOREX.com, the online trading brand of StoneX, a US financial services group | November | $3,700, then $3,570 | Gold was testing $3,840, which gave way on 18 November; momentum readings suggested selling could ease in the short term | 0.7%; 4.2% |
| Zorrays Junaid | Alchemy Markets, an online broker | November | About $3,650 | One more leg down completes the wave pattern he tracks, and a base could form near this level | 2.0% |
| Société Générale’s technical analysts | One of France’s largest banks | November | $3,625, then $3,440–3,480 | No sign yet of a meaningful rebound; $3,440–3,480 is the lower edge of a downward channel that has held for months | 2.7%; 6.6–7.7% |
| Julian Pineda | FOREX.com | November | $3,600 | Critical support: a major low last seen in September 2025 | 3.4% |
| Muhammad Umair | FXEmpire | November | $3,500–3,600, then $3,000–3,200 | The first support zone; a break below it could take gold to $3,000–3,200 | 3.4–6.1%; 14.1–19.5% |
| Marc Chandler | Bannockburn Global Forex, a New York currency research firm | November | $3,500 | No significant low in place yet; a break of the $3,750 area could take gold to $3,500 | 6.1% |
| Fawad Razaqzada | StoneX | November | $3,500 | His target of $3,737 has been met; $3,500 is the next major one | 6.1% |
| James Stanley | FOREX.com | November | $3,500 | The next level below; it capped gold’s highs until the Federal Reserve chair’s speech at the Jackson Hole conference in August 2025 | 6.1% |
| Christopher Lewis | FXEmpire | November | About $3,500 | Technical support, with selling expected on any rally | 6.1% |
| Joni Teves | UBS, the largest Swiss bank | November | $3,800, then $3,500 | Expected $3,800 to hold, with $3,500 in focus on a break; gold closed below $3,800 on 18 November | 6.1% |
| Jesse Colombo | The BubbleBubble Report, an independent research newsletter | November | $3,400–3,500 | Little support below $3,900 on US gold futures until this range | 6.1–8.7% |
| Tai Wong | Independent analyst | November | $3,350–3,450 | Unless the fall reverses quickly, a test of this range in the coming weeks | 7.4–10.1% |
| Alex Kuptsikevich | FxPro, an online broker | November | $3,300 | The target of the downward trend | 11.4% |
| Daniel Pavilonis | StoneX | November | About $3,200, the average price of the last 200 weeks | Within reach if the Federal Reserve raises rates aggressively, in half-point steps | 14.1% |
The last column is a Golden Ark calculation from source data: how far each level sits below the close on 18 November. The views of Marc Chandler, Jesse Colombo, Alex Kuptsikevich and Daniel Pavilonis come from the weekly survey of Kitco News, the news service of the Canadian precious metals dealer Kitco. Jesse Colombo’s levels refer to gold futures on COMEX, the main US futures exchange for gold; the others refer to the spot price. In November gold traded below the three nearest levels, according to Reuters.
Why $3,500 comes up so often
On 22 April 2025 gold set a record just above $3,500 an ounce, according to Reuters. James Stanley of FOREX.com notes that the level then capped gold’s highs until the Federal Reserve chair’s speech at the Jackson Hole conference in August 2025. Seven of the fifteen analysts quoted name it or a range that includes it, and Société Générale places the lower edge of its channel just below. Fawad Razaqzada adds a chart reason: a standard projection from gold’s rally of June–August 2026 ends just under the same level.
What would show the fall has stopped
Analysts and the World Gold Council, the gold industry’s market development organisation, look for three kinds of evidence: lost levels regained, conditions seen at past floors, and signs that selling is exhausted.
Levels the price would need to regain
Analysts name the levels gold would have to regain before they would call a low. Most count a close above a level, so a brief move through it during the day does not change their reading.
| Analyst | Published | Level | What regaining it would show | Above the 18 November close |
|---|---|---|---|---|
| FXStreet, a currency and markets news site (analysis by Dhwani Mehta) | 19 November | $3,753–3,800, then $3,962, the average close of the last 21 trading days | The first caps on any rebound | 0.7–2.0%; 6.3% |
| Arslan Ali, FXEmpire | 19 November | $3,755, then $3,791 | Below $3,755 the short-term picture stays negative; a close above it opens $3,791 | 0.8%; 1.8% |
| World Gold Council | 2 November | $3,858, where gold would have given back 38.2% of its whole rise since 2015 | It looked for a floor here on closing prices; a sustained close below it would keep the trend pointing down. Gold has closed below it since 16 November | 3.5% |
| Société Générale | 16 and 19 November | $3,870–3,900, the October low; then about $4,150, the average close of the last 50 trading days | Failing to regain the October low would extend the decline; the 50-day average caps a rebound | 3.9–4.7%; 11.4% |
| Michael Boutros, FOREX.com | 17 November | $3,901, $3,943 (key), $4,036 | Regaining the falling trend line would strengthen the case for a more significant low | 4.7%; 5.8%; 8.3% |
| Muhammad Umair, FXEmpire | 19 November | $4,000 | A recovery above it would confirm a bottom and open $4,400 | 7.4% |
| Fawad Razaqzada, StoneX | 19 November | About $4,140, the early-November high | A move above it would trigger a turn, unlikely within days; before that, a reversal pattern near the lows and an end to the run of lower lows and lower highs | 11.1% |
The last column is a Golden Ark calculation from source data: how far each level sits above the close on 18 November.
The World Gold Council’s three conditions
Johan Palmberg, a senior quantitative analyst at the World Gold Council, tests three conditions that have accompanied recoveries in gold’s past declines since 2005. A condition counts when its reading is among the most extreme 30% of months in those declines.
| Condition | What it measures | 5 November | Latest reading |
|---|---|---|---|
| Price far below its long-term average | How far gold trades below its 200-day average, the average close of the last 200 trading days | Met: about 10% below | The 200-day average stood at $4,415.17 on 19 November; the 18 November close was about 16% below it |
| A sharp rise in the dollar | How far the dollar index has climbed compared with the past 52 weeks | Met: the dollar near the top of its range | At its highest since April 2025 (Reuters, 19 November) |
| Speculators’ bets cut back | How small the bets of speculators, such as funds, on a rise in gold futures have become compared with all open contracts | Not met: the bets are still large | Large speculators added to their bets in the week to 10 November, before gold fell below $3,800, according to the Commodity Futures Trading Commission, the US futures regulator |
In each of the five cases when all three conditions were met, gold was higher three months later. The World Gold Council notes that five cases are a small number and that the test looks only three months ahead. On 5 November it saw gold as possibly near a low for the time being, with the third condition still missing.
| Month when all three conditions were met | Gold three months later |
|---|---|
| October 2008 | +28.2% |
| May 2012 | +8.4% |
| November 2015 | +16.3% |
| December 2016 | +8.9% |
| September 2022 | +9.8% |
Source: World Gold Council, Gold Market Commentary, 5 November 2026.
Oversold readings
Oversold readings show how fast the price has fallen. A widely used one is the relative strength index, which compares recent gains with recent losses; readings near or below 30 count as oversold. On their own, such readings do not show where a fall ends. Several analysts see room for a rebound as gold nears the supports they named, and Fawad Razaqzada of StoneX adds that an oversold reading alone does not signal a low.
| Reading | What it points to | Who | Published |
|---|---|---|---|
| Daily relative strength index near 30 | An oversold market | Dhwani Mehta, FXStreet | 19 November |
| Relative strength index oversold on several chart timeframes | A short-term bounce, though not by itself a low | Fawad Razaqzada, StoneX | 19 November |
| A weekly momentum gauge more oversold than at any time since 2013 | Room for a rebound; the dollar also looks overbought | David Morrison, Trade Nation, an online broker | 18 November |
| Momentum rising while the price falls, on daily and 4-hour charts | Selling could weaken in the short term | Michael Boutros, FOREX.com | 17 November |
| One more leg down, to about $3,650, completes the price pattern he tracks | A base and a rally from that support | Zorrays Junaid, Alchemy Markets | 17 November |
| No sign yet of a meaningful rebound | A longer decline unless the October low is regained | Société Générale | 19 November |
| Rebounds sold quickly | Every bounce likely to be short-lived | Dhwani Mehta, FXStreet | 17 November |
What could end the decline, and when
Sources tie the end of the decline to five conditions; new readings of each arrive on set dates, most of them by 10 December.
| Condition | Latest reading | Date |
|---|---|---|
| US interest rates stop rising | Futures markets price a 94% chance of a quarter-point increase on 9 December and 6% for a half-point one, according to Reuters | 19 November |
| Lower real interest rates: the return on 10-year inflation-protected US government bonds | 2.88%, up from 2.62% on 2 November, according to the US Treasury | 18 November |
| A weaker dollar | The dollar index at its highest since April 2025, according to Reuters | 19 November |
| Speculators’ bets cut back | Large speculators added to their bets in the week to 10 November, according to the Commodity Futures Trading Commission | 10 November |
| Steady buying by central banks and gold-backed funds | Central banks bought 321 tonnes in July–September, 42% more than a year earlier; funds held a record 4,275 tonnes at the end of October (World Gold Council) | 3 and 5 November |
Gold pays no interest, so higher returns on bonds make holding it more costly, and a stronger dollar makes it dearer for buyers who pay in other currencies.
| Who | Condition | What they say | Published |
|---|---|---|---|
| Bank of America, one of the largest US banks | Rates; dollar | Gold is likely to bottom out only once inflation worries ease, the dollar stops rising and the Federal Reserve is no longer raising rates; the bank expects an average of $4,813 in 2027 | 12 October |
| Goldman Sachs, one of the largest US investment banks | Rates | Cut its gold forecasts twice in November as it pushed back the expected end of rate increases; its economists see the first cut in December 2027 | 5 and 14 November |
| Joni Teves, UBS | Real rates | Real interest rates are too high for investors to ignore, and a recovery may take patience | 18 November |
| David Morrison, Trade Nation | Dollar | The dollar looks somewhat overbought and may need a pullback, though not imminently | 18 November |
| World Gold Council | Dollar | When gold has fallen because the dollar spiked, the weakness has tended to be temporary | 5 November |
| World Gold Council | Speculators’ bets | A clear-out of speculative positions is needed for a more durable recovery | 5 November |
| Joni Teves, UBS | Speculators’ bets; central banks and funds | The sell-off reflects positioning more than a change in the market’s direction; long-term investors are hesitant rather than selling out, fund holdings have held up, and central-bank buying has picked up as prices fell | 18 November |
| Goldman Sachs | Central banks | Central banks are buying an estimated 85 tonnes a month, against 17 tonnes a month before 2022 | 5 November |
| ANZ, one of Australia’s largest banks | Buying after the fall | Opportunistic buying could give some support after the sell-off | 18 November |
The decision on 9 December comes with policymakers’ projections, which show how many more increases they themselves expect.
| Date | Time (London) | What is published | Condition it updates |
|---|---|---|---|
| Wednesday 25 November | 13:30 | US personal income and spending for October, with the inflation measure the Federal Reserve targets; second estimate of growth for July–September | Rates |
| Friday 4 December | 13:30 | US employment report for November, the last before the Federal Reserve decision | Rates |
| Early December | — | World Gold Council figures on central-bank buying for October and fund flows for November | Central banks and funds |
| Monday 7 December | — | China’s central bank reports its gold reserves for November | Central banks |
| Wednesday 9 December | 19:00 | Federal Reserve decision, with policymakers’ projections and the chair’s press conference | Rates |
| Thursday 10 December | 13:30 | US consumer prices for November | Rates and real rates |
| Every week | — | Commodity Futures Trading Commission report on positions in gold futures | Speculators’ bets |
The full calendar to 31 December and the bank forecasts for the end of 2026 are in the November forecast update.
How earlier declines found a floor
Two records show how gold has behaved on the way down: the lows and rebounds of 2026 so far, and the World Gold Council’s history of gold’s largest falls since 1974.
Lows and rebounds in 2026
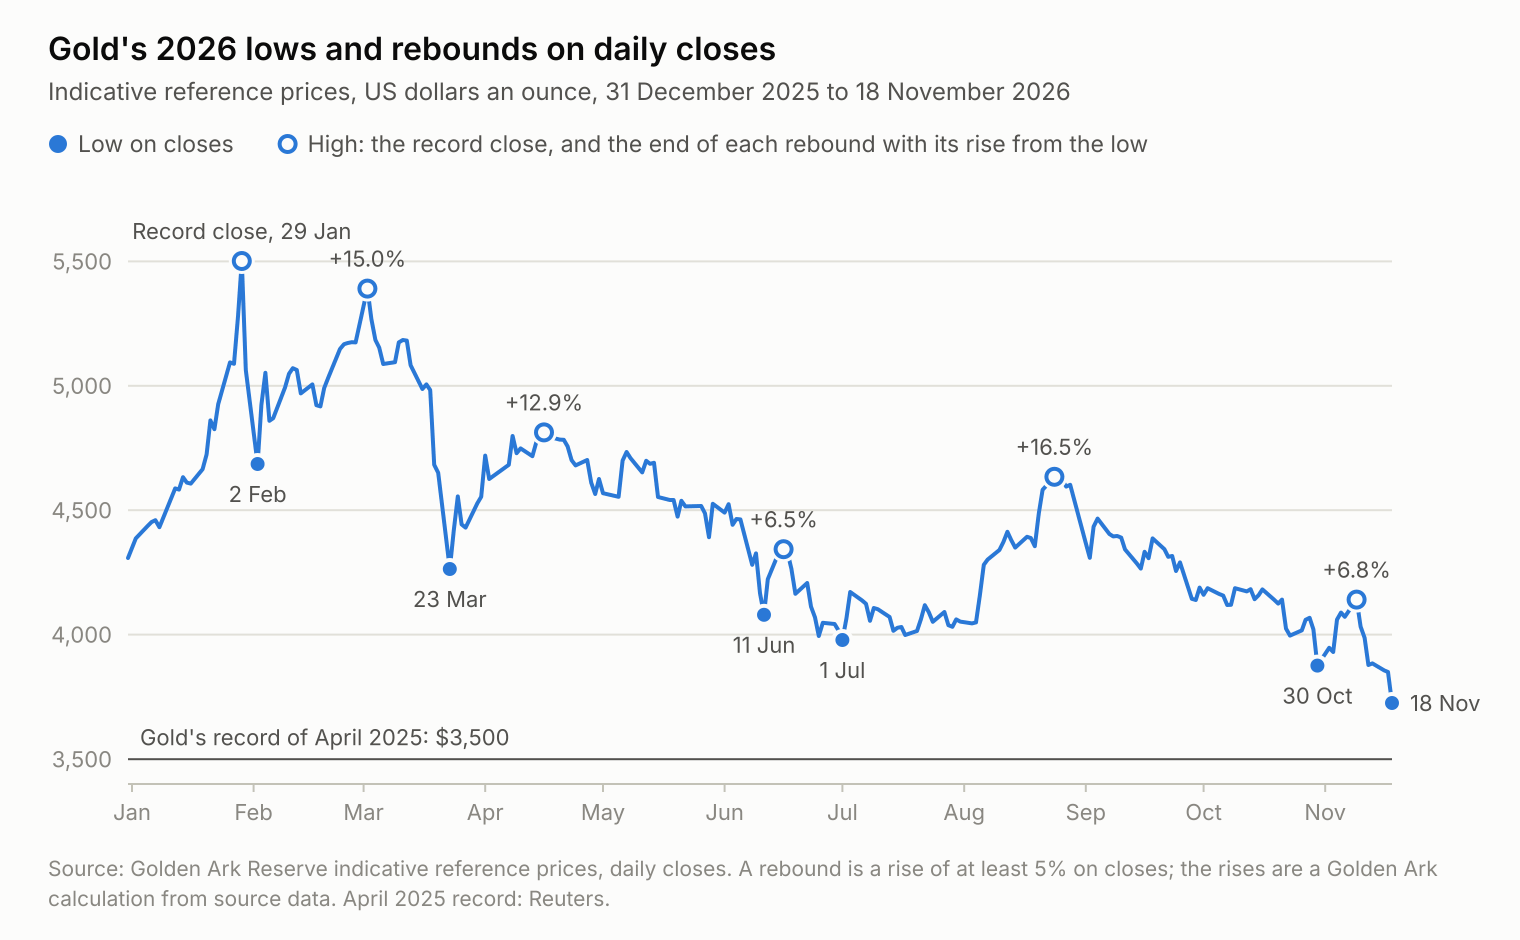
Since the January record, every low on closing prices has led to a rebound, and every rebound to a lower low. The rebounds lifted the price by between 6.5% and 16.5% and lasted from five days to almost eight weeks. The rebound that ended on 2 March came about 2% short of the record; the one that ended on 9 November stopped about a quarter below it.
| Low | Close | Below the record close | Rebound ended | Close | Rise | Days |
|---|---|---|---|---|---|---|
| 2 February | $4,685.45 | 14.8% | 2 March | $5,390.45 | 15.0% | 28 |
| 23 March | $4,263.55 | 22.5% | 16 April | $4,812.95 | 12.9% | 24 |
| 11 June | $4,079.85 | 25.8% | 16 June | $4,343.30 | 6.5% | 5 |
| 1 July | $3,978.55 | 27.7% | 24 August | $4,634.20 | 16.5% | 54 |
| 30 October | $3,875.65 | 29.6% | 9 November | $4,140.91 | 6.8% | 10 |
| 18 November | $3,725.77 | 32.3% | — | — | — | — |
Closing prices are indicative reference prices; the record close was set on 29 January. A rebound here is a rise of at least 5% on closing prices. The percentages and days are a Golden Ark calculation from source data. On 19 November the price fell further during the day.
Five pullbacks since 1974
The World Gold Council counts five large declines in gold since 1974, measured on month-end prices. Four of them came with rising real interest rates and a stronger dollar.
| Decline | Price at start | Price at end | Fall | Length | Main drivers, per the World Gold Council |
|---|---|---|---|---|---|
| November 1974 – August 1976 | $184 | $104 | 43% | 21 months | Rising real interest rates and a stronger dollar |
| September 1980 – June 1982 | $667 | $318 | 52% | 21 months | Steep rate increases under Federal Reserve chair Paul Volcker, record real interest rates, a stronger dollar and easing inflation |
| January 1983 – February 1985 | $500 | $288 | 42% | 25 months | Federal Reserve rate increases, rising real interest rates, a stronger dollar and weaker demand for safe havens |
| November 1987 – August 1999 | $493 | $255 | 48% | 141 months | Central-bank selling, rising mine supply and a long rise in share prices |
| August 2011 – December 2015 | $1,814 | $1,060 | 42% | 52 months | Rising real interest rates and a stronger dollar as central-bank bond buying ended and US rates rose; outflows from gold-backed funds; growing mine output |
Prices are month-end values of the benchmark price set each afternoon in London. The length column is a Golden Ark calculation from source data.
The World Gold Council’s table uses month-end prices, which smooth out daily swings; on daily closes, the 2026 decline reached 32.3% on 18 November, almost ten months after the record. On 5 November the World Gold Council judged the current fall closer to a correction than to the four-year decline that followed 2011.
The last of the five pullbacks ended in December 2015, the month the Federal Reserve raised rates for the first time in nearly a decade. The World Gold Council’s three conditions were met again in September 2022, in the middle of a series of rate increases that began in March 2022.
How to read a support level
A support level is an analyst’s reading of past prices: a point where buyers have stepped in before. It describes the past and carries no date, and when a level breaks, analysts move to the next one, as several did between 16 and 19 November.
Levels from different sources rarely match. They differ by market, spot gold or futures, and by the price used, a close or a move during the day. Methods differ too, from round numbers and earlier highs and lows to averages and projections from past moves.
None of the levels or views on this page is Golden Ark Reserve’s own. Golden Ark Reserve publishes no price forecast, does not endorse any of these figures, and nothing here is investment advice or a recommendation on when to buy or sell.
Gold bars are listed with indicative prices in the gold bars catalogue. After payment, the price is fixed, including the premium.
Sources
Prices and market moves
- Gold prices: Golden Ark Reserve indicative reference prices: the current price and its changes, and daily closes from 31 December 2025 to 18 November 2026
- Reuters, via Kitco News: Gold sinks to 1-year low as Treasury yields and dollar bite, set for worst year since 2015 (16 November 2026)
- Reuters, via The Korea Times: Gold hits 14-month low as strong dollar, rate bets weigh (19 November 2026)
- Investing.com: Spot gold sheds over 3%, drops below $3,800/oz for first time since September 2025 (18 November 2026), for the ANZ view
- The Nation, Thailand: Gold hits 14-month low on Nov 18 as US dollar strengthens (19 November 2026), for Tai Wong’s view
- BullionVault: Gold price news, 16 November 2026
- US Treasury: Daily par real yield curve rates, November 2026
- Commodity Futures Trading Commission report for 10 November, as summarised by COT Reports (16 November 2026)
Analysts’ levels and views
- Arslan Ali, FXEmpire: Gold Stuck Near 14-Month Low as Fed Hike Bets Build, Can $3,707 Hold? (19 November 2026)
- Michael Boutros, FOREX.com: Gold Price Short-term Outlook: XAU/USD Bears Face Critical Test at Yearly Lows (17 November 2026)
- Zorrays Junaid and Dhwani Mehta, FXStreet: Gold today: 96% odds of a December hike keep sellers targeting $3,820 (17 November 2026)
- Société Générale, via FXStreet: Gold: Downtrend extends towards lower projections (16 November 2026) and the FXStreet gold report of 19 November 2026
- Julian Pineda, FOREX.com: Gold Analysis: Why Does XAU/USD Keep Losing Ground? (19 November 2026)
- Muhammad Umair, FXEmpire: Gold Price Forecast: Falling Stocks Fail to Lift Gold as Dollar Rises (19 November 2026)
- Fawad Razaqzada, StoneX: Gold and silver forecast: Stretched dollar leaves XAU and XAG in need of a reversal (19 November 2026)
- James Stanley, FOREX.com: Gold Breaks Down but is This a Sign of What’s to Come? (18 November 2026)
- Christopher Lewis, FXEmpire: Gold Price Forecast: $3,500 Support in Focus as Selling Deepens (18 November 2026)
- Joni Teves, UBS, via Investing.com and Yahoo Finance: Why isn’t gold rallying despite its bullish investment case? UBS explains (18 November 2026)
- Dhwani Mehta, FXStreet: $3,700 breached: Gold sellers extend control on hawkish Fed outlook (19 November 2026)
- David Morrison, Trade Nation, via Kitco News: As silver underperforms gold, has its bubble popped? (18 November 2026)
- Marc Chandler, Jesse Colombo, Alex Kuptsikevich and Daniel Pavilonis, in the Kitco News weekly survey: Wall Street bears abound after inflation sours Fed outlook (13 November 2026)
- Bank of America, via Kitco News: Gold price needs dovish Fed or renewed debasement fears to reverse (12 October 2026)
- Goldman Sachs, via investingLive: ICYMI: Goldman cuts gold forecasts to $4,150 for 2026, $4,800 for 2027 as hawkish Fed bites (November 2026); via Kitco News: Goldman Sachs cuts year-end gold price target (13 November 2026); via Investing.com: Goldman Sachs just slashed its 2027 gold forecast (14 November 2026)
World Gold Council
- Gold Market Commentary: Where floor art thou? (5 November 2026)
- Weekly Markets Monitor: Leveraged repricers (2 November 2026)
- Gold Demand Trends, third quarter 2026 (3 November 2026)
- Gold ETF flows, October 2026 (5 November 2026)
- What’s a bear case for gold: A historical perspective and its appendix (10 July 2025)
Federal Reserve, calendar and history
- Federal Reserve: meeting calendar
- Federal Reserve: changes in the target range for the federal funds rate, for the increase of December 2015 and the increases from March 2022 to July 2023
- US data releases: US Bureau of Labor Statistics, December 2026 schedule, US Bureau of Economic Analysis
- China’s central bank, monthly reserve figures: China Daily Hong Kong (7 November 2026)
- The record of April 2025: Reuters, via Kitco News (22 April 2025)
Latest insights
- Gold Price Forecast for the Rest of 2026, Week by Week
- Silver Price Forecast 2027: Bank and Analyst Targets
- Silver Price Forecast to the End of 2026: Bank Targets
- Why Is Gold Falling? Drivers of the 2026 Correction