Gold Price Forecast for the Rest of 2026, Week by Week
November update: gold price forecasts for the end of 2026, this week's surveys, and each week to 31 December with its US data, Fed dates and holidays.
In this article
- Where gold stands in mid-November
- Where the forecasts for the end of 2026 stand on 16 November
- Goldman Sachs: two cuts in November
- Forecasts of the 2026 average
- Forecasts for 2027
- What could lift gold by the end of 2026, and what could hold it back
- Latest readings
- This week, 16–20 November
- Weekly surveys and short-term ranges
- What is scheduled from 16 to 20 November
- Chart levels analysts are watching
- The weeks to 31 December
- 7–11 December: the Fed decision, November inflation and the funding deadline
- 21–31 December: holidays and the last prices of the year
- How accurate gold forecasts have been
- The LBMA annual survey
- Forecasts for 2026 made at the start of the year
- Weekly surveys
- How to read a dated forecast
- Other metals
- Sources
Gold has lost more than a quarter of its value since its record in January, yet every bank forecast for the end of 2026 is still above the price. Banks have trimmed their figures through the autumn, Goldman Sachs, one of the largest US investment banks, twice in November, but none of the new figures is below the price in mid-November. Central banks keep buying gold, while US interest rates weigh on it: markets expect the Federal Reserve, the US central bank, to raise its rate again in December. The six weeks left in 2026 hold the dates that can bring the price toward the forecasts or take it further away.
Where gold stands in mid-November
All prices on this page are indicative reference prices: delayed, rounded figures from third-party market data; none is a price at which gold can be bought or sold. Changes are worked out from daily closing prices.
Gold lost 4.6% in the week to 13 November. US inflation data and comments from Federal Reserve officials drove most of the move. Highs and lows during the day come from Kitco News, the news service of the Canadian precious metals dealer Kitco, which also surveys gold analysts every week.
| Date | What happened | Close |
|---|---|---|
| Friday 6 November | Close of the previous week | $4,071.61 |
| Monday 9 November | A weaker dollar and cheaper oil lifted gold above $4,100; during the day it reached $4,148.95, the high of the week, according to Kitco News | $4,140.91 |
| Tuesday 10 November | US consumer prices rose 0.4% in October, against a forecast of 0.3%; excluding food and energy, they rose 0.3%, against 0.2%. Markets began to price a possible half-point rate increase in December | $4,032.50 |
| Wednesday 11 November | Fed officials pointed to further increases; the dollar index, which measures the US currency against six others, rose to 102.8, its highest since April 2025 | $3,987.71 |
| Thursday 12 November | The yield on 10-year US government bonds rose to about 5.10%, and Brent crude, the international oil benchmark, gained 3%; during the day gold touched $3,852.10, its lowest since October 2025, according to Kitco News | $3,877.96 |
| Friday 13 November | US producer prices rose 0.3% in October, below the forecast of 0.4%, and 6.5% from a year earlier, the largest 12-month rise since November 2022 | $3,884.55 |
The Bureau of Labor Statistics, the US government agency behind the official inflation figures, gave no 12-month change in consumer prices for October. It collected no prices in October 2025, during the government shutdown, so there is no year-earlier figure to compare with. Monthly rises were 0.4% in August, 0.6% in September and 0.4% in October; in September, prices were 3.7% higher than a year earlier.
The Federal Reserve raised its rate to 3.75–4.00% on 16 September, its first increase in three years, held it on 28 October and meets next on 8–9 December. On 16 November, futures prices gave a 90% chance of a quarter-point increase at that meeting and a 10% chance of a half-point one. The figures come from CME FedWatch, a tool of CME Group, which runs COMEX, the main US market for gold futures.
On Monday morning, 16 November, gold traded between $3,832.43 and $3,901.29 and stood at $3,874.09 at 11:41 GMT. Friday’s close was 29.4% below the record close of $5,501.70 on 29 January and 9.8% below the close of 2025, $4,307.95. The lowest close of 2026 so far is $3,875.65, on 30 October; in the fourth quarter, closes have ranged from that low to $4,186.90 on 9 October.
At Friday’s close, every bank forecast for the end of 2026 was above the price. The causes of the fall from the January record are set out in why gold has fallen in 2026.
Where the forecasts for the end of 2026 stand on 16 November
Every bank forecast for the end of 2026 or for its last three months is above the close of $3,884.55 on 13 November. The rise needed to reach them runs from 3.0% to 31.3%.
| Forecaster | Forecast | What the figure covers | Published | Change from the previous forecast | Rise needed from the 13 November close |
|---|---|---|---|---|---|
| Bank of America (one of the largest US banks) | $4,000 | Average for October–December 2026 | 30 September, repeated on 12 October | New quarterly figure | 3.0% |
| Goldman Sachs (one of the largest US investment banks) | $4,150 | Price at the end of 2026 | 5 November | Down from $4,650 (18 September) | 6.8% |
| Jefferies (US investment bank whose analysts cover mining companies) | $4,400 | Average for October–December 2026 | 9 October | Down from $4,600 | 13.3% |
| Morgan Stanley (one of the largest US investment banks) | $4,450 | October–December 2026 | Set earlier in the year; on 20 August the bank said gold had reached it ahead of time | — | 14.6% |
| JPMorgan (the largest US bank) | $4,500 | Average for October–December 2026 | 3 July | Down from about $6,000 | 15.8% |
| CIBC (one of Canada’s five largest banks) | $4,500 | October–December 2026 | 20 October | Down from $6,500 at the start of the year | 15.8% |
| Commerzbank (one of Germany’s largest banks) | $4,500 | Price at the end of 2026 | 28 July | Down from $4,800 (4 June) | 15.8% |
| Citi (one of the largest US banks) | $4,500 | The next three months | Early November, as reported by Reuters, the international news agency | Down from $4,800 (24 August) | 15.8% |
| UBS (the largest Swiss bank) | $4,600 | Price in December 2026 | Late July, repeated in October | Down from $5,500 (27 May) | 18.4% |
| ING (the largest Dutch bank) | $4,600 | Average for October–December 2026 | 24 June | Down from $5,000 | 18.4% |
| Standard Chartered (London-based bank with most of its business in Asia, Africa and the Middle East) | $4,650 | Average for October–December 2026 | 10 November | Same as on 21 September | 19.7% |
| HSBC (one of Europe’s largest banks, based in London) | $4,750 | Price at the end of 2026 | 9 July | On 1 October HSBC cut its average for 2026; reports gave no new year-end figure | 22.3% |
| Société Générale (one of France’s largest banks) | $4,750 | End of 2026 (fourth quarter) | 18 September | $6,000 in January | 22.3% |
| Wells Fargo Investment Institute (research arm of Wells Fargo, one of the largest US banks) | $4,900–5,100 | Price at the end of 2026 | Week of 17 August | Down from $5,300–5,500 | 26.1–31.3% |
The last column is a Golden Ark calculation from source data: the rise from the 13 November close to each forecast.
2026 / November update
Bank forecasts above the market
Every value shown is above the 13 November close — horizons differ.
| Forecaster | Horizon / publication | USD per troy ounce | Forecast / rise needed |
|---|---|---|---|
| Bank of America | Q4 average30 Sep / 12 Oct | $4,000+3.0% | |
| Goldman Sachs | Year-end5 Nov | $4,150+6.8% | |
| Jefferies | Q4 average9 Oct | $4,400+13.3% | |
| Morgan Stanley | Q4 periodEarlier / 20 Aug | $4,450+14.6% | |
| JPMorgan | Q4 average3 Jul | $4,500+15.8% | |
| CIBC | Q4 period20 Oct | $4,500+15.8% | |
| Commerzbank | Year-end28 Jul | $4,500+15.8% | |
| Citi | Next 3 monthsEarly Nov | $4,500+15.8% | |
| UBS | DecemberLate Jul / Oct | $4,600+18.4% | |
| ING | Q4 average24 Jun | $4,600+18.4% | |
| Standard Chartered | Q4 average10 Nov | $4,650+19.7% | |
| HSBC | Year-end9 Jul | $4,750+22.3% | |
| Société Générale | Year-end / Q418 Sep | $4,750+22.3% | |
| Wells Fargo Investment Institute | Year-endWeek of 17 Aug | $4,900–5,100+26.1–31.3% |
Year-end, December, Q4 and rolling forecasts describe different periods. Citi covers the next three months. Rise needed is measured from the 13 November close. Sources: bank research and reports listed under Sources below; Golden Ark Reserve indicative reference prices.
Banks measure different things. Some forecast the price on a set date, such as the end of the year or December. Others forecast an average for October–December, and the weeks already traded count toward it. Closes from 1 October to 13 November averaged $4,075.73, below every quarterly average in the table except Bank of America’s. For those averages to hold, prices in the remaining weeks would have to run above the forecast itself.
Since the October update on 1 October, four banks in the table have lowered their figures, and each new figure is still above the price. Three others repeated theirs. How the year-end figures developed through October is set out in the gold price forecast to the end of 2026.
Goldman Sachs: two cuts in November
Goldman Sachs lowered its forecasts twice in two weeks. On 5 November it cut its end-2026 figure to $4,150 from $4,650 and its end-2027 figure to $4,800 from $5,400, assuming a Fed rate increase in December. The bank still gives central banks a large role. It assumes they buy 60 tonnes a month in 2026 and 2027, against 17 tonnes a month before 2022; its latest estimate of their actual buying is 85 tonnes a month.
On 14 November the bank cut its end-2027 figure again, to $4,650. Its economists now expect a third quarter-point increase in March 2027 and the first rate cuts from December 2027. The new figure is close to the $4,660 of the bank’s earlier scenario in which the Fed also raises rates in March. Reports of the second note did not mention the end-2026 figure.
Even after both cuts, Goldman’s figures are above the price: $4,150 for the end of 2026 is 6.8% above the 13 November close, and $4,650 for the end of 2027 is 19.7% above it.
Forecasts of the 2026 average
Some forecasters publish an average for the whole of 2026. Such an average already contains nine months of prices. Gold averaged $4,873 in January–March, $4,506 in April–June and $4,262 in July–September, according to the World Gold Council (WGC). The WGC is the gold industry’s market development organisation and publishes the quarterly Gold Demand Trends report on world supply and demand. Its averages use the LBMA Gold Price PM, the benchmark price set each afternoon in the London gold market under the rules of the LBMA, the market’s trade association.
| Forecaster | Average for 2026 | Published | Change from the previous forecast | Average for October–December that the figure implies |
|---|---|---|---|---|
| HSBC | $4,490 | 1 October | Down from $4,560 (9 July) | About $4,320 |
| Reuters poll (survey of about 30 analysts and traders that Reuters runs every quarter) | $4,495 | 27 October | Down from $4,509 (July) | About $4,340 |
| Jefferies | $4,511 | 9 October | Down from $4,595 | About $4,400 |
| World Bank (international lender that publishes commodity price forecasts twice a year) | $4,600 | 28 October, in its Commodity Markets Outlook | Down from $4,700 (April) | About $4,760 |
| Metals Focus (London research firm that collects the demand data used by the World Gold Council) | $4,600 | 21 October | Not reported | About $4,760 |
The last column is a Golden Ark calculation from source data. It counts each quarter as a quarter of the year: four times the yearly average, minus the three quarterly averages so far. For Jefferies, which also publishes a quarterly figure, the result matches its own forecast of $4,400 for October–December.
All five averages imply that October–December averages more than gold’s close on 13 November. Closes from 1 October to 13 November averaged $4,075.73. For any of the five averages to hold, prices in the remaining weeks would have to run above about $4,320.
Forecasts for 2027
Forecasts for 2027 are higher still. Each figure in the table is at least 19.7% above the 13 November close.
| Forecaster | Forecast | What the figure covers | Published | Rise needed from the 13 November close |
|---|---|---|---|---|
| Goldman Sachs | $4,650 | Price at the end of 2027 | 14 November | 19.7% |
| Reuters poll | $4,650 | Average for 2027 | 27 October | 19.7% |
| State Street Global Advisors (one of the world’s largest asset managers) | $4,750–5,500 | Base case to the end of March 2027 | October | 22.3–41.6% |
| Bank of America | About $4,800 | Average for 2027 | 12 October | 23.6% |
| HSBC | $4,825 | Average for 2027 | 1 October | 24.2% |
| Standard Chartered | $4,850 | Average for January–March 2027 | 10 November | 24.9% |
| Citi | $5,000 | The next 6–12 months | Early November, as reported by Reuters | 28.7% |
| Jefferies | $5,000 | 2027 | 9 October | 28.7% |
| LBMA conference delegates (participants in the yearly conference of the London precious metals market) | $5,013.30 | Price in October 2027 | October 2026 | 29.1% |
| Morgan Stanley | $5,050 | Average for 2027 | 8 October | 30.0% |
| Société Générale | $5,125 | Average for 2027 | 18 September | 31.9% |
| CIBC | $5,200 | Average for 2027 | 20 October | 33.9% |
| Metals Focus | $5,330 | Average for 2027 | 21 October | 37.2% |
| UBS | $5,400 | Price at the end of September 2027 | Repeated in early November | 39.0% |
The last column is a Golden Ark calculation from source data. Bank of America expects gold to recover to about $4,800 in 2027 once the Fed stops raising rates.
What could lift gold by the end of 2026, and what could hold it back
The case for a rise rests on central banks, fund buying and the gap between the price and every bank forecast. The case against rests on US interest rates and the dollar.
| Argument | Direction | Who makes it | When |
|---|---|---|---|
| Every bank forecast for the end of 2026 is above the 13 November close | Up | Fourteen banks | June–November |
| Central banks bought 321 tonnes of gold in July–September, 42% more than a year earlier | Up | World Gold Council | 3 November |
| China’s central bank added 25.8 tonnes in October, its 24th monthly purchase in a row and the largest since September 2023 | Up | People’s Bank of China, in its monthly reserve figures | 7 November |
| Central banks will buy more gold this year than the bank expected, and gold will average $4,650 in October–December | Up | Standard Chartered | 10 November |
| The fall in the gold price has gone too far | Up | Commerzbank | 3 November |
| Gold-backed funds took in $2.7 billion in October, and their holdings reached a record 4,275 tonnes | Up | World Gold Council | 5 November |
| Gold is about 10% below its 200-day average, which the WGC treats as a downside extreme; two of the three signs it uses to spot a floor are present | Up | World Gold Council | 5 November |
| Gold may be nearing a bottom, after more short-term pressure | Up | HSBC | 1 October |
| Futures prices treat a Fed rate increase on 9 December as all but certain | Down | CME FedWatch | 16 November |
| The return on 10-year inflation-protected US government bonds rose to 2.91%, from 2.63% a week earlier; gold pays no interest | Down | US Treasury yield figures | 13 November |
| The dollar index reached its highest level since April 2025 | Down | Market data | 11 November |
| Most analysts surveyed, 62%, expect gold to fall this week | Down | Kitco News weekly survey | 13 November |
| Gold-backed funds had their first weekly outflow since late June, led by Europe | Down | World Gold Council | 9 November |
| Buying of bars and coins fell 19%, and of jewellery 17%, in July–September | Down | World Gold Council | 3 November |
| Gold is unlikely to hold above $4,000 over the next three months | Down | Bank of America | 12 October |
| Speculative positions in gold futures are still high: the third sign of a floor is missing | Down | World Gold Council | 5 November |
Gold pays no interest, so higher returns on bonds raise the cost of holding it instead. Several forecasters link a recovery to the end of Fed rate increases.
Central-bank buying has continued through the autumn fall. In September central banks bought 61 tonnes, the most in any month of 2026, according to the WGC.
Latest readings
| Measure | Latest | Earlier |
|---|---|---|
| Chance of a Fed rate increase on 9 December | 90% for a quarter point and 10% for a half point (16 November) | 80.7% for an increase (5 November) |
| US consumer prices, change in the month | +0.4% in October | +0.6% in September |
| US producer prices, change over 12 months | +6.5% in October | +6.3% in September |
| Dollar index | Above 103 (13 November) | About 101.2 (5 November) |
| Yield on 10-year US government bonds | About 5.15% (13 November) | About 4.93% (4 November) |
| Return on 10-year inflation-protected US government bonds | 2.91% (13 November) | 2.63% (6 November) |
| Net bets on a higher gold price by fund managers on COMEX | 324 tonnes (WGC, 9 November) | — |
| Gold held by gold-backed funds | Record 4,275 tonnes at the end of October | 4,256 tonnes at the end of September |
This week, 16–20 November
The only forecasts dated to this week are weekly surveys and short-term price ranges.
Weekly surveys and short-term ranges
Every Friday Kitco News asks Wall Street analysts, and in a separate online poll its readers, whether gold will rise, fall or trade sideways in the week ahead.
| Survey of 13 November | Rise | Fall | Sideways | Responses |
|---|---|---|---|---|
| Wall Street analysts | 15% | 62% | 23% | 13 |
| Main Street online poll | 42% | 38% | 21% | 160 |
| Analyst | This week | Reason given |
|---|---|---|
| Marc Chandler, Bannockburn Global Forex (New York currency research firm) | Lower | Sees no floor yet |
| James Stanley, Forex.com (online currency and metals broker) | Higher | Expects a rebound, though not sure it will hold |
| Adrian Day, Adrian Day Asset Management (US investment firm) | Sideways | Positive over the long term; the dollar and inflation from oil prices weigh for now |
| Daniel Pavilonis, StoneX (US financial services firm) | Lower | A half-point rate increase could bring a sharper fall |
| Jesse Colombo, The BubbleBubble Report (independent research newsletter) | Lower | The dollar is the main headwind |
| Alex Kuptsikevich, FxPro (online broker) | Lower | A stronger dollar and high bond yields |
| Michael Moor, Moor Analytics (technical analysis firm) | Lower | Chart signals |
| CPM Group (New York commodities research firm) | Range of $3,800–4,160 to 27 November | Based on December gold futures on COMEX |
What is scheduled from 16 to 20 November
Times are London time (GMT).
| Day | Event | Time | Why it matters for gold |
|---|---|---|---|
| Monday 16 November | Fed governor Michael Barr speaks on artificial intelligence and financial stability, in Milan | 10:00 | The first Fed remarks of the week |
| Monday 16 November | Empire State survey of New York factories | 13:30 | Factory activity feeds the Fed’s view of the economy |
| Monday 16 November | Fed chairman Kevin Warsh opens a conference on productivity and jobs at the San Francisco Fed; it covers the economic impact of new technologies and is streamed online | 17:00 | Any remark on inflation or rates from the chairman |
| Tuesday 17 November | US retail sales for October; forecast 0.0% | 13:30 | A measure of consumer demand, which the Fed weighs alongside inflation |
| Tuesday 17 November | Fed governor Christopher Waller speaks on payments | 14:10 | Any comment on the October inflation figures |
| Tuesday 17 November | US industrial production for October | 14:15 | Output of factories, mines and utilities |
| Wednesday 18 November | Minutes of the Fed meeting of 27–28 October | 19:00 | The record of a meeting at which two of the 12 voters wanted an increase |
| Thursday 19 November | Weekly jobless claims; forecast 200,000 | 13:30 | The state of the labour market |
| Thursday 19 November | Philadelphia Fed survey of factories | 13:30 | Factory activity |
| Friday 20 November | University of Michigan consumer survey, final November reading; forecast 51.0 | 15:00 | Consumer mood and inflation expectations |
| Friday 20 November | Fed governor Lisa Cook speaks on the US economy in a global context, in Santiago | 17:15 | Cook voted for an increase in October |
Chart levels analysts are watching
Technical analysts read levels from charts of past prices. Such a level describes the past; it is not a forecast.
The World Gold Council’s commentary of 5 November, with data to 28 October, found gold about 10% below its 200-day average, the average close of the last 200 trading days. The WGC also marked $3,857, where gold would have given back 38.2% of its whole rise since 2015, as a level that might still be tested. On the morning of 16 November gold traded as low as $3,832.43.
| Analyst | Level | What they say |
|---|---|---|
| Marc Chandler | $3,852.70; $3,750; $3,500 | The low of the year so far; the next target; a break below it could point to $3,500 |
| Jesse Colombo | $3,900 on COMEX futures; $3,500–3,400 | A major support that has held since late 2025 and was tested in March, June and July; below it, little support until $3,500–3,400 |
| Daniel Pavilonis | The 100-week average; about $3,200, the 200-week average | Gold trades at its 100-week average; aggressive rate increases could take it toward the 200-week average |
| Alex Kuptsikevich | $3,300 | The target of the downward trend |
| James Stanley | $4,000 | Expects a rebound above it, though not sure it will hold |
| CPM Group | $3,800–4,160 | Its range for 13–27 November; $4,000 was a support until gold fell below it |
Market data / October–November 2026
Gold’s October–November decline
Daily closes to 13 November; the CPM range is a separate forward-looking forecast.
CPM GROUP · $3,800–4,160
13–27 November 2026 · December COMEX futures
Reference levels: $4,000 · $3,900 · $3,857 · $3,750. On 30 October the close was $3,875.65. The line shows all 32 daily closes from 1 October to 13 November.
Daily closing prices · USD per troy ounce
| Date · 2026 | Close |
|---|---|
| $4,159.85 | |
| $4,186.60 | |
| $4,163.45 | |
| $4,156.90 | |
| $4,119.10 | |
| $4,120.35 | |
| $4,186.90 | |
| $4,173.85 |
| Date · 2026 | Close |
|---|---|
| $4,182.45 | |
| $4,142.10 | |
| $4,158.20 | |
| $4,181.90 | |
| $4,140.44 | |
| $4,125.22 | |
| $4,141.02 | |
| $4,024.50 |
| Date · 2026 | Close |
|---|---|
| $3,996.30 | |
| $4,017.19 | |
| $4,060.12 | |
| $4,067.59 | |
| $4,021.42 | |
| $3,875.65 | |
| $3,947.36 | |
| $3,930.25 |
| Date · 2026 | Close |
|---|---|
| $4,060.69 | |
| $4,088.73 | |
| $4,071.61 | |
| $4,140.91 | |
| $4,032.50 | |
| $3,987.71 | |
| $3,877.96 | |
| $3,884.55 |
Sources: Golden Ark Reserve indicative reference prices; CPM Group (December COMEX futures). The shaded range refers only to 13–27 November and a separate instrument; it is not a continuation of the historical closing-price series.
The weeks to 31 December
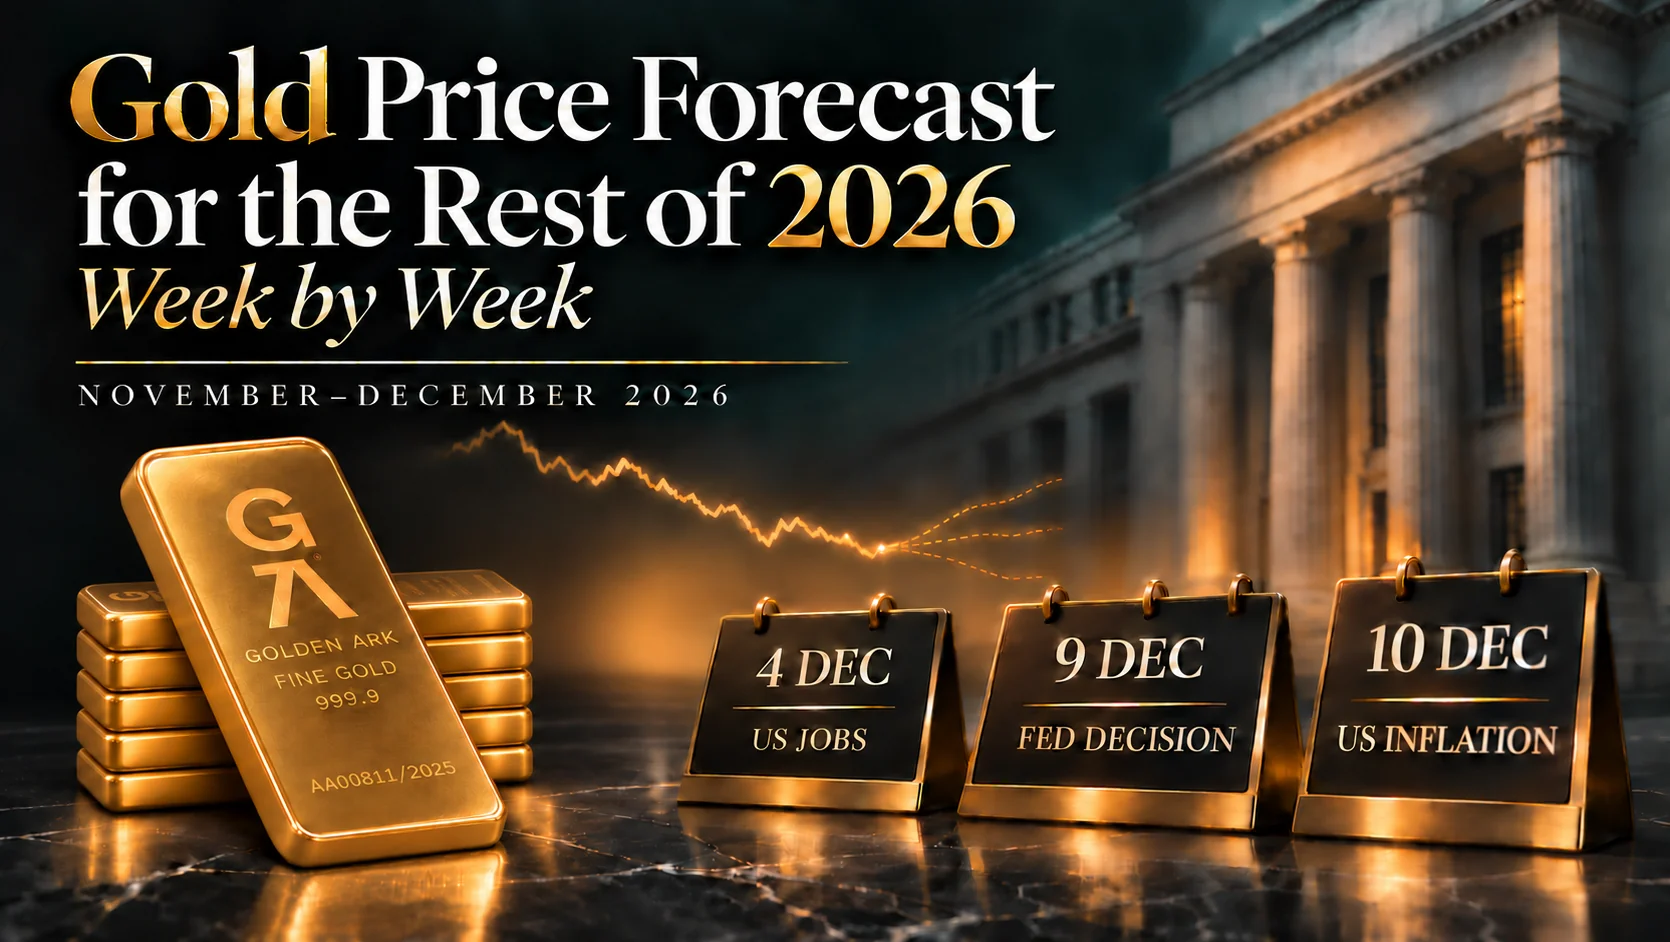
After this week, six more remain in 2026. Each brings its own data, Fed events and market holidays, and the forecasts for the end of the year fall due in the last of them. Kitco News usually publishes its weekly survey at the end of each week.
| Week | What is scheduled (London time) | Forecasts that fall due |
|---|---|---|
| 23–27 November | 25 Nov: second estimate of US growth for July–September, and personal income and spending for October with the PCE price index, the inflation measure the Fed targets (13:30); the Fed’s Beige Book, a survey of business conditions across the country (19:00). 26 Nov: Thanksgiving, US markets closed. 27 Nov: shortened US trading day | The CPM Group range for 13–27 November ends |
| 30 November–4 December | 1 Dec: US job openings for October (15:00). 4 Dec: US employment report for November, the last before the Fed decision (13:30). Early December, expected: World Gold Council figures on central-bank buying for October and fund flows for November, and its Gold Outlook 2027 | — |
| 7–11 December | 7 Dec: China’s central bank reports its gold reserves for November. 9 Dec: Fed decision with policymakers’ projections (19:00). 10 Dec: US consumer prices for November (13:30). 11 Dec: US government funding runs out unless Congress extends it | — |
| 14–18 December | 15 Dec: US producer prices for November (13:30). 17 Dec: rate decisions of the Bank of England, the UK’s central bank (12:00), and the European Central Bank, the euro area’s central bank (12:45). 18 Dec: rate decision of the Bank of Japan, Japan’s central bank | — |
| 21–25 December | 23 Dec: third estimate of US growth, and personal income and spending for November with the PCE price index (13:30). 24 Dec: early close in the US; no afternoon LBMA Gold Price. 25 Dec: Christmas, London and New York closed | — |
| 28–31 December | 28 Dec: UK holiday, no LBMA Gold Price. 30 Dec: last afternoon LBMA Gold Price of 2026; minutes of the December Fed meeting expected. 31 Dec: last trading day of the year; London sets only the morning price | Forecasts for the end of 2026 and for October–December fall due; UBS’s figure covers the whole of December |
The weeks ahead / 2026
The dates that can move gold
Selected events · 23 November–31 December 2026
0123–27 NOVEMBER
- US GDP + PCE; Fed Beige Book
- Thanksgiving: US markets closed
- Shortened US trading session
0230 NOVEMBER – 4 DECEMBER
- US job openings
- US employment report
Last jobs report before the Fed decision
037–11 DECEMBER
- China gold reserves
- Fed decision + projections
- US CPI
- US government funding deadline
0414–18 DECEMBER
- US producer prices
- Bank of England + ECB
- Bank of Japan
0521–25 DECEMBER
- US GDP + PCE
- Early US close; no LBMA PM price
- London + New York closed
0628–31 DECEMBER
- UK holiday; no LBMA price
- Final LBMA PM price; Fed minutes*
- Last trading day; LBMA AM only
Sources: the calendars listed under Sources below. Selected events only; the table above gives the full schedule with London times. *Fed minutes expected on 30 December.
7–11 December: the Fed decision, November inflation and the funding deadline
Three events fall within three days. On 9 December the Fed announces its decision together with policymakers’ projections for interest rates, growth and inflation, and Kevin Warsh, the Fed chairman, holds a press conference. The projections show how many more rate increases policymakers themselves expect; several forecasters link a recovery in gold to the end of increases.
US consumer prices for November come out on 10 December, so the Fed decides before the figures are known. Futures prices already treat an increase on 9 December as all but certain.
US government funding runs out on 11 December. Without an extension by Congress, part of the federal government shuts down from 12 December. The last shutdown lasted 43 days, from 1 October to 12 November 2025, and stopped the collection of October consumer prices. Goldman Sachs expects a short-term extension, according to the International Business Times, a US business news site.
On 7 December China’s central bank reports its reserves for November. It has added gold for 24 months in a row.
21–31 December: holidays and the last prices of the year
London and New York close for Christmas on 25 December, and London also on 28 December, the substitute holiday for Boxing Day. On 24 December US markets close early, and there is no afternoon LBMA Gold Price.
The last afternoon LBMA Gold Price of 2026 is set on 30 December. On 31 December, the last trading day of the year, London sets only the morning price.
A forecast for the end of the year can be checked against the closing price on 31 December or, for the London benchmark, against the afternoon price of 30 December. Averages for October–December include every trading day of the quarter.
In January the LBMA runs its survey for 2027 and announces how close its analysts came for 2026. The next Reuters poll is due around the end of January.
How accurate gold forecasts have been
A forecast can be checked once its date has passed, and the LBMA keeps the longest public record for gold.
The LBMA annual survey
Each January the LBMA asks between 25 and 30 analysts for their forecast of the year’s average gold price. A year later it publishes the actual average next to their forecasts.
| Year | Average forecast, made in January | Actual average for the year | Difference |
|---|---|---|---|
| 2023 | $1,859 | $1,940.54 | Forecast 4.2% below the actual |
| 2024 | $2,058.96 | $2,386.20 | Forecast 13.7% below the actual |
| 2025 | $2,735.33 | $3,431.54 | Forecast 20.3% below the actual |
| 2026 | $4,741.97 | The year is not over: $4,873 in January–March, $4,506 in April–June, $4,262 in July–September | — |
The last column is a Golden Ark calculation from source data.
Forecast accuracy / LBMA
When forecasts fell short
January consensus versus actual annual average · USD/oz
2023
Forecast −4.2% vs actual
2024
Forecast −13.7% vs actual
2025
Forecast −20.3% vs actual
Source: LBMA forecast survey results for 2023–2025, listed under Sources below. The bar scale starts at zero. Only completed years 2023–2025 are included; 2026 is unfinished. Shortfall is measured against the actual annual average.
In each of the three complete years, gold averaged more than the analysts expected. For 2026, the forecast of $4,741.97 sits between the averages of the first and second quarters.
A study in the Alchemist, the LBMA’s journal, looked at the survey from 1997 to 2024 across all the metals it covers. The consensus missed the year’s average by about 9% a year, though misses in both directions nearly cancelled out, to about 1%. When prices rose sharply, analysts tended to underestimate the rise; when prices fell, they tended to overestimate the fall.
In July the LBMA’s mid-year survey of 16 analysts put the 2026 average at $4,604 and the year-end price at about $4,500.
Forecasts for 2026 made at the start of the year
Most banks set or raised their 2026 forecasts in January, as gold rose to its record close of $5,501.70 on 29 January. Since then most have cut them as the price fell.
| Forecaster | What the figure covers | At the start of 2026 | Latest | Earlier changes |
|---|---|---|---|---|
| Goldman Sachs | Price at the end of 2026 | $5,400 (22 January) | $4,150 (5 November) | $4,900 in June; $4,650 on 18 September |
| UBS | Price at the end of 2026 | $5,900, with $6,200 for March, June and September (29 January) | $4,600 for December (late July) | $5,500 on 27 May |
| Société Générale | End of 2026 | $6,000 (26 January) | $4,750 for the fourth quarter (18 September) | — |
| JPMorgan | Average for October–December 2026 | $5,055 (set in October 2025) | $4,500 (3 July) | $6,300 in February; about $6,000 in June |
| CIBC | October–December 2026 | $6,500 (start of the year) | $4,500 (20 October) | — |
| Commerzbank | Price at the end of 2026 | $4,900 (13 January) | $4,500 (28 July) | $5,000 on 27 March; $4,800 on 4 June |
| HSBC | Average for 2026 | $4,587 (8 January) | $4,490 (1 October) | $4,864 later in the first half; $4,560 on 9 July |
| Bank of America | Average for 2026; later October–December | $4,538 (November 2025) | $4,000 for October–December (30 September) | — |
| Wells Fargo Investment Institute | Price at the end of 2026 | $4,500–4,700 (set at the end of 2025) | $4,900–5,100 (week of 17 August) | $6,100–6,300 in February; $5,300–5,500 by June |
| LBMA survey | Average for 2026 | $4,741.97 (January) | $4,604 in the July survey (12 August) | — |
| Reuters poll | Average for 2026 | $4,746.50 (4 February) | $4,495 (27 October) | $4,916 in April; $4,509 in July |
Wells Fargo Investment Institute’s latest range is above the one it gave at the end of 2025. Every other figure in the table is lower than at the start of the year. Even after the cuts, every latest figure is above the close of 13 November.
Weekly surveys
Kitco’s weekly survey can be checked a week later. In the three weeks with a result, the largest group of Wall Street analysts matched the direction of the following week twice, and the largest group of Main Street readers once.
| Survey (Friday) | Wall Street: rise / fall / sideways | Main Street: rise / fall / sideways | Close on the day | Close a week later | Change |
|---|---|---|---|---|---|
| 23 October | 24% / 41% / 35% | 42% / 26% / 33% | $3,996.30 | $3,875.65 | −3.0% |
| 30 October | 6% / 63% / 31% | 53% / 30% / 16% | $3,875.65 | $4,071.61 | +5.1% |
| 6 November | 31% / 38% / 31% | 68% / 15% / 18% | $4,071.61 | $3,884.55 | −4.6% |
| 13 November | 15% / 62% / 23% | 42% / 38% / 21% | $3,884.55 | Due on 20 November | — |
The last column is a Golden Ark calculation from source data.
How to read a dated forecast
A forecast belongs to the date it was made and the period it covers. A weekly survey shows what analysts and readers expect for the coming days. A bank figure covers a set date or a set period, such as the end of the year or October–December, and banks revise it as the price and the data change. A figure published before 10 November was made without the October inflation report.
None of the forecasts on this page is Golden Ark Reserve’s own. The page records what other institutions have published, with dates and sources; Golden Ark Reserve publishes no price forecast, does not endorse any of these figures, and nothing here is investment advice or a recommendation on when to buy or sell. Gold bars are listed with indicative prices in the gold bars catalogue. After payment, the price is fixed, including the premium.
Other metals
Bank forecasts for silver at the end of 2026 are set out the same way in the silver price forecast to the end of 2026.
Sources
Prices and market moves
- Gold prices: Golden Ark Reserve indicative reference prices, daily closes from 25 September to 13 November 2026, and the price at 11:41 GMT on 16 November 2026
- The week of 9–13 November, intraday highs and lows: Kitco News (13 November 2026)
- US consumer prices, bond yields and the dollar on 13 November: Admiral Markets (13 November 2026)
- The dollar index on 11 November: Trading Economics (11 November 2026)
- Futures odds for 9 December: Reuters, via MarketScreener (16 November 2026)
- Odds, the dollar index and bond yields after the US elections: Finimize, citing Reuters and CME FedWatch (5 November 2026), Kitco News (4 November 2026)
- Returns on inflation-protected US government bonds: US Treasury, daily par real yield curve rates (November 2026)
US data and the Federal Reserve
- Consumer prices for October: US Bureau of Labor Statistics (10 November 2026), and its notice on 12-month changes
- Producer prices for October: US Bureau of Labor Statistics (13 November 2026); for September: The Economics Daily, US Bureau of Labor Statistics (21 October 2026)
- Consumer prices for September: 24/7 Wall St. (16 October 2026)
- The 2025 shutdown and the October price survey: investingLive (November 2026)
- Fed decisions of 16 September and 28 October: Admiral Markets (28 October 2026)
- Fed speeches and minutes, 16–20 November: Federal Reserve, November 2026 calendar; the conference of 16 November: Federal Reserve Bank of San Francisco
- The Fed meeting of 8–9 December: Federal Reserve, meeting calendar
- US government funding: International Business Times
Bank forecasts
- Bank of America: Kitco News (5 January 2026), investingLive (30 September 2026), Kitco News (12 October 2026), investingLive (13 October 2026)
- Goldman Sachs: SRN News, carrying Reuters (January 2026), Mining.com (June 2026), investingLive (September 2026), investingLive (November 2026), Kitco News (13 November 2026), Investing.com (14 November 2026), investingLive (November 2026)
- Jefferies: Kitco News (14 October 2026), Canadian Mining Report (15 October 2026)
- Morgan Stanley: Eurasia Business News (20 August 2026), Canadian Mining Report (9 October 2026)
- JPMorgan: Kitco News, carrying Reuters (23 October 2025), WebProNews (July 2026), Engineering News, carrying Reuters (6 July 2026), SMM (6 July 2026)
- CIBC: Kitco News (20 October 2026)
- Commerzbank: Informist (13 January 2026), Informist (27 March 2026), Kitco News (4 June 2026), Kitco News (28 July 2026), FXStreet (3 November 2026)
- Citi: investingLive (25 August 2026), investingLive, citing Reuters (November 2026)
- UBS: Engineering News, carrying Reuters (30 January 2026), Canadian Mining Report (26 October 2026), Canadian Mining Report (2 November 2026)
- ING: Kitco News (24 June 2026), FXStreet (24 June 2026)
- Standard Chartered: Kitco News (11 November 2026)
- HSBC: investingLive (8 January 2026), Metalsmine, carrying Reuters (9 July 2026), Newsquawk (1 October 2026), ScrapMonster (5 October 2026)
- Société Générale: FXStreet (26 January 2026), Kitco News (18 September 2026)
- Wells Fargo Investment Institute: Institute Alert (4 February 2026), investingLive (August 2026)
- State Street Global Advisors: Kitco News (27 October 2026)
Polls, surveys and research
- World Gold Council, Gold Demand Trends: first quarter (29 April 2026), second quarter (30 July 2026), third quarter and its central banks section (November 2026)
- World Gold Council, other reports: fund flows for October (November 2026), Weekly Markets Monitor (9 November 2026), Gold Market Commentary for October (5 November 2026); central-bank buying in September: FXStreet (5 November 2026)
- China’s central bank in October: China Daily Hong Kong (7 November 2026)
- Reuters polls: Kitco News, carrying Reuters (4 February 2026), Kitco News, carrying Reuters (27 April 2026), Kitco News, carrying Reuters (29 July 2026), WMBD, carrying Reuters (27 October 2026)
- World Bank: Kitco News (5 November 2026)
- Metals Focus: SMM (21 October 2026)
- LBMA forecast survey: results for 2023, 2024 and 2025; 2026 survey (January 2026); the study of 1997–2024 in the Alchemist; the July survey: Kitco News (12 August 2026)
- LBMA conference delegates: Kitco News (6 October 2026)
- Kitco News weekly surveys: 23 October, 30 October, 6 November and 13 November 2026 (listed above), with the analysts’ views, levels and the CPM Group range
Calendar
- US data releases: US Bureau of Labor Statistics, December 2026, US Bureau of Economic Analysis
- Central bank decisions in December: Finance Calendar
- Holidays and trading hours: CME Group, ICE Benchmark Administration, LBMA Gold Price holiday calendar 2026, LBMA (15 December 2025), City A.M.
Latest insights
- Silver Price Forecast 2027: Bank and Analyst Targets
- Silver Price Forecast to the End of 2026: Bank Targets
- Why Is Gold Falling? Drivers of the 2026 Correction
- Gold Price Forecast to the End of 2026: Bank Targets